By Philip Russom, TDWI Research Director
[NOTE -- My new TDWI report about High-Performance Data Warehousing (HiPer DW) is finished and will be published in October. The report’s Webinar will broadcast on October 9, 2012. In the meantime, I’ll leak a few of the report’s findings in this blog series. Search Twitter for #HiPerDW to find other leaks. Enjoy!]
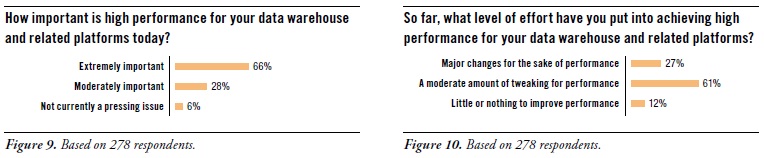
No one denies that HiPer DW is important. (See Figure 9. [shown above]) Two thirds of survey respondents called it extremely important (66%), while a quarter called it moderately important (28%). A mere 6% said that HiPer DW is not currently a pressing issue.
The wide majority of users surveyed are doing something about it. (See Figure 10. [shown above]) Luckily, most organizations can achieve their performance goals with a moderate amount of tweaking (61%). Even so, others have made major changes for the sake of performance (27%). Given that a third of user organizations are contemplating a change of platform to gain higher performance (as seen in Figure 7 [not shown in this blog]), more major changes are coming.
Whether major changes or moderate tweaking, there is a fair amount of work being done for the performance optimization of BI/DW/DI and analytic systems. To find out why, the survey asked: “Why do you need to invest time and money into performance enhancements?” (See Figure 11. [not shown in this blog])
Business needs optimal performance from systems for BI/DW/DI and analytics. This is clear from survey responses, such as: business practices demand faster and bigger BI and analytics (68%) and business strategy seeks maximum value from each system (19%). On the dark side of the issue, it’s sometimes true that [business] users’ expectations of performance are unrealistic (9%). In a similar vein, one response to “Other” said that “regulatory requirements demand timely reporting.”
Keeping pace with growth is a common reason for performance optimization. Considerable percentages of the experienced users responding to this survey question selected growth-related answers, such as scaling up to large data volumes (46%), scaling to greater analytic complexity (32%), and scaling to larger user communities with more reports (25%).
One way to keep pace with growth is to upgrade hardware. This is seen in the following responses: We keep adding more data without upgrading hardware (14%), and we keep adding users and applications without upgrading hardware (8%). Another way to put it is that adding more and heftier hardware is a tried-and-true method of optimization, though – when taken to extremes – it raises costs and dulls optimization skills.
Performance optimization occasionally compensates for tool deficiencies. Luckily, this is not too common. Very few respondents reported tool-related optimizations, such as: our BI and analytic tools are not high performance (15%), our database software is not high performance (6%), our BI and analytic tools do not take advantage of database software (4%), and our database software does not have features we need (3%). In other words, tools and platforms for BI/DW/DI and analytics perform adequately for the experienced users surveyed here. Their work in performance optimization most often targets new businesKeeping pace with growth is a common reason for performance optimization.s requirements and growing volumes of data, reports, and users – not tool and platform deficiencies.
EXPERT COMMENT -- Query optimizers do a lot of the work for us.
A database expert interviewed for this report said: “The query optimizer built into a vendor’s database management system can be a real life saver. But there’s also a lot of room for improvement. Most optimizers work best with well-written queries of modest size with predictable syntax. And that’s okay, because most queries fit that description today. However, as a wider range of people get into query-based analytics, query optimizers need to also improve poorly written queries. These can span hundreds of lines of complex SQL, with convoluted predicate structures, due to ad hoc methods, calling out to non-SQL procedures, or by mixing SQL from multiple hand-coded and tool-generated sources.”
Want more? Register for my HiPer DW Webinar, coming up Oct.9 noon ET.
Read other blogs in this series:
Opportunities for HiPer DW
The Four Dimensions of HiPer DW
Defining HiPer DW
High Performance: The Secret of Success and Survival
Posted by Philip Russom, Ph.D.0 comments
By Philip Russom, TDWI Research Director
[NOTE -- My new TDWI report about High-Performance Data Warehousing (HiPer DW) is finished and will be published in October. The report’s Webinar will broadcast on October 9, 2012. In the meantime, I’ll leak a few of the report’s findings in this blog series. Search Twitter for #HiPerDW to find other leaks. Enjoy!]
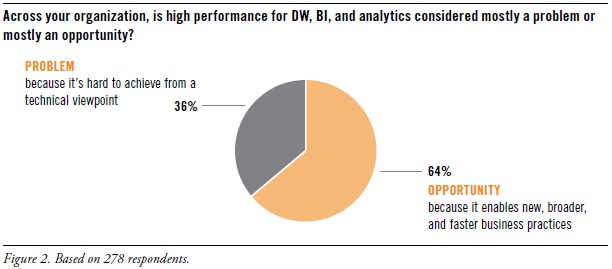
In recent years, TDWI has seen many user organizations adopt new vendor platforms and user best practices, which helped overcome some of the performance issues that dogged them for years, especial data volume scalability and real-time data movement for operational BI. With that progress in mind, a TDWI survey asked: “Across your organization, is high performance for DW, BI, and analytics considered mostly a problem or mostly an opportunity?” (See Figure 2, shown above.)
Two thirds (64%) consider high performance an opportunity. This positive assessment isn’t surprising, given the success of real-time practices like operational BI. Similarly, many user organizations have turned the corner on big data, no longer struggling to merely manage it, but instead leveraging its valuable information through exploratory or predictive analytics, to discover new facts about customers, markets, partners, costs, and operations.
Only a third (36%) consider high performance a problem. Unfortunately, some organizations still struggle to meet user expectations and service level agreements for queries, cubes, reports, and analytic workloads. Data volume alone is a show stopper for some organizations. Common performance bottlenecks center on loading large data volumes into a data warehouse, running reports that involve complex table joins, and presenting time-sensitive data to business managers.
BENEFITS OF HIGH-PERFORMANCE DATA WAREHOUSING
Analytic methods are the primary beneficiaries of high performance. Advanced analytics (mining, statistics, complex SQL; 62%) and big data for analytics (40%) top the list of practices most likely to benefit from high performance, with basic analysis (OLAP and its variants; 26%) not too far down the list. High performance is critical for analytic methods because they demand hefty system resources, they are evolving toward real-time response, and they are a rising priority for business users.
Real-time BI practices are also key beneficiaries of HiPer DW. High performance can assist practices that include a number of real-time functions, including operational business intelligence (37%), dashboards and performance management (34%), operational analytics (30%), and automated decisions for real-time processes (25%). Don’t forget: the incremental movement toward real-time operation is the most influential trend in BI today, in that it affects every layer of the BI/DW/DI and analytics technology stack, plus user practices.
System performance can contribute to business processes that rely on data or BI/DW/DI infrastructure. These include business decisions and strategies (33%), customer experience and service (21%), business performance and execution (19%), and data-driven corporate objectives (14%).
Enterprise business intelligence (EBI) needs all the performance help it can get. By definition, EBI involves thousands of users (most of them concurrent) and tens of thousands of reports (most refreshed on a 24-hour cycle). Given its size and complexity, EBI can be a performance problem. Yet, survey respondents don’t seem that concerned about EBI, with few respondents selecting EBI issues, such as standard reports (15%), supporting thousands of concurrent users (15%), and refreshing thousands of reports (12%).
Want more? Register for my HiPer DW Webinar, coming up Oct.9 noon ET.
Read other blogs in this series:
The Four Dimensions of HiPer DW
Defining HiPer DW
High Performance: The Secret of Success and Survival
Posted by Philip Russom, Ph.D.0 comments
By Philip Russom, TDWI Research Director
[NOTE -- My new TDWI report about High-Performance Data Warehousing (HiPer DW) is finished and will be published in October. The report’s Webinar will broadcast on October 9, 2013. In the meantime, I’ll leak a few of the report’s findings in this blog series. Search Twitter for #HiPerDW to find other leaks. Enjoy!]
FIGURE 1.
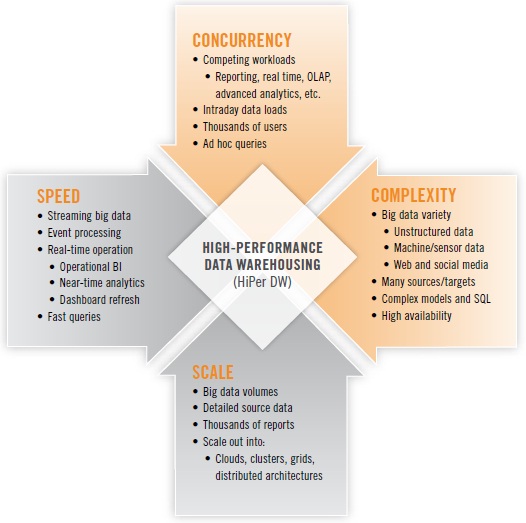
High-performance data warehousing (HiPer DW) is primarily about achieving speed and scale, while also coping with increasing complexity and concurrency. These are the four dimensions that define HiPer DW. Each dimension can be a goal unto itself; yet, the four are related. For example, scaling up may require speed, and complexity and concurrency tend to inhibit speed and scale. The four dimensions of HiPer DW are summarized in Figure 1 above.
Here follow a few examples of each:
SPEED. The now-common practice of operational BI usually involves fetching and presenting operational data (typically from ERP and CRM applications) in real time or close to it. Just as operational BI has pushed many organizations closer and closer to real-time operation, the emerging practice of operational analytics will do the same for a variety of analytic methods. Many analytic methods are based on SQL, making the speed of query response more urgent than ever. Other analytic methods are even more challenging for performance, due to iterative analytic operations for variable selection and reduction, binning, and neural net construction. Out on the leading edge, events and some forms of big data stream from Web servers, transactional systems, media feeds, robotics, and sensors; an increasing number of user organizations are now capturing and analyzing these streams, then making decisions or taking actions within minutes or hours.
SCALE. Upon hearing the term “scalability,” most of us immediately think of the burgeoning data volumes we’ve been experiencing since the 1990s. Data volumes have recently spiked in the phenomenon known as “big data,” which forces organizations to manage tens of terabytes – sometimes hundreds of terabytes, even petabytes – of detailed source data of varying types. But it’s not just data volumes and the databases that manage them. Scalability is also required of BI platforms that now support thousands of users, along with their thousands of reports that must be refreshed. Nor is it just a matter of scaling up; all kinds of platforms must scale out into ever larger grids, clusters, clouds, and other distributed architectures.
COMPLEXITY. Complexity has increased steadily with the addition of more data sources and targets, not to mention more tables, dimensions, and hierarchies within DWs. Today, complexity is accelerating, as more user organizations embrace the diversity of big data, with its unstructured data, semi-structured data, and machine data. As data’s diversity increases, so does the complexity of its management and processing. Some organizations are assuring high performance for some workloads (especially real time and advanced analytics) by deploying standalone systems for these; one of the trade-offs is that the resulting distributed DW architecture has complexity that makes it difficult to optimize the performance of processes that run across multiple platforms.
CONCURRENCY. As we scale up to more analytic applications and more BI users, an increasing number of them are concurrent—that is, using the BI/DW/DI and analytics technology stack simultaneously. In a similar trend, the average EDW now supports more database workloads – more often running concurrently – than ever before, driven up by the growth of real-time operation, event processing, advanced analytics, and multi-structured data.
Want more? Register for my HiPer DW Webinar, coming up Oct.9 noon ET.
Read other blogs in this series:
Defining HiPerDW
High Performance: The Secret of Success and Survival
0 comments
By Philip Russom, TDWI Research Director
[
NOTE -- My new TDWI report about High-Performance Data Warehousing (HiPer DW) is finished and will be published in October. The report’s Webinar will broadcast on October 9, 2013. In the meantime, I’ll leak a few of the report’s findings in this blog series. Search Twitter for #HiPerDW to find other leaks. Enjoy!]
Data used to be just data. Now there’s big data, real-time data, multi-structured data, analytic data, and machine data. Likewise, user communities have swollen into thousands of concurrent users, reports, dashboards, scorecards, and analyses. The rising popularity of advanced analytics has driven up the number of power users, with their titanic ad hoc queries and analytic workloads. And there are still brave new worlds to explore, such as social media and sensor data.
The aggressive growth of data and attendant disciplines has piled additional stresses on the performance of systems for business intelligence (BI), data warehousing (DW), data integration (DI), and analytics. The stress, in turn, threatens new business practices that need these systems to handle bigger and faster workloads. Just think about modern analytic practices that depend on real-time data, namely operational BI, streaming analytics, just-in-time inventory, facility monitoring, price optimization, fraud detection, and mobile asset management. Many of the latest practices apply business analytics to leveraging big data, which is a performance double whammy of heavy analytic workloads and extreme scalability.
The good news for BI, DW, DI, and analytic practices is that solutions for high-performance are available today. These solutions involve a mix of vendor tools or platforms and user designs or optimizations. For example, the vendor community has recently delivered new types of database management systems, analytic tools, platforms, and tool features that greatly assist performance. And users continue to develop their skills for high-performance architectures and designs, plus tactical tweaking and tuning. This report [to be published in October 2013] refers this eclectic mix of vendor products and user practices as high-performance data warehousing (HiPer DW).
In most user organizations, a DW and similar databases bear much of the burden of performance; yet, the quest for speed and scale also applies to every layer of the complex BI/DW/DI and analytics technology stack, as well as processes that unfold across multiple layers. Hence, in this report, the term high-performance data warehousing (HiPer DW) encompasses performance characteristics, issues, and enablers across the entire technology stack and associated practices.
HiPer DW Solutions combine Vendor Functionality with User Optimizations
Performance goals are challenging to achieve. Luckily, many of today’s challenges are addressed by technical advancements in vendor tools and platforms.
For example, there are now multiple high-performance platform architectures available for data warehouses, including massively parallel processing (MPP), grids, clusters, server virtualization, clouds, and SaaS. For real-time data, databases and data integration tools are now much better at handling streaming big data, service buses, SOA, Web services, data federation, virtualization, and event processing. 64-bit computing has fueled an explosion of in-memory databases and in-memory analytic processing in user solutions; flash memory and solid-state drives will soon fuel even more innovative practices. Other performance enhancements have recently come from multi-core CPUs, appliances, columnar storage, high-availability features, Hadoop, MapReduce, and in-database analytics. Later sections of this report will discuss in detail how these and other innovations assist with high performance.
Vendor tools and platforms are indispensible, but HiPer DW still requires a fair amount of optimization by technical users. The best optimizations are those that are designed into the BI and analytic deliverables that users produce, such as queries, reports, data models, analytic models, interfaces, and jobs for extract, transform, and load (ETL). As we’ll see later in this report, successful user organizations have pre-determined standards, styles sheets, architectures, and designs that foster high performance and other desirable characteristics. Vendor tools and user standards together solve a lot of performance problems up front, but there’s still a need for the tactical tweaking and of tuning of user-built BI deliverables and analytic applications. Hence, team members with skills in SQL tuning and model tweaking remain very valuable.
Want more? Register for my HiPer DW Webinar, coming up Oct.9 noon ET:
http://bit.ly/HiPerDWwebinar
Posted by Philip Russom, Ph.D.0 comments
Business decision cycles are turning faster, and to keep up, executives and managers are in constant need of new data and new types of reporting and analysis. Dynamic organizations are demanding greater agility from their business intelligence (BI) systems. TDWI Research is currently examining how well organizations are able to adjust their BI and data warehouse (DW) development, deployment, and management to enable greater agility.
How is your organization doing in addressing user demands for more agile BI/DW? What are your toughest challenges? We would very much like to include your opinions and insights in the TDWI Research survey, which is live right now. Thank you to everyone who has already participated in the survey. As part of my research for what will ultimately be a TDWI Best Practices Report, I am also conducting interviews with professionals to understand their experiences with agile development methods for BI/DW and with deploying self-service BI, data virtualization, and other technologies that are helping organizations become more agile. If you are interested, please drop me a line at [email protected].
With survey data coming in, it’s hard not to take a peek at what we have so far. Respondents say that the business factors having the most disruptive impact, requiring greater business and IT agility, are increased competition (74%, with 20% calling it “very disruptive”), economic or global instability (68%), shorter decision cycles (65%), and technology modernization (62%). Changes in customer behavior form the fifth highest factor, with 60%. The largest percentage of respondents (45%) say that their organizations are “average” at adjusting to change and taking advantage of emerging opportunities, with 10% saying that their organization is “excellent,” 31% saying “good,” and 14% saying “poor.”
Other questions in the survey will provide data for deeper insight into where challenges are most acute in terms of BI/DW development processes and technologies. One of the biggest issues regarding agility is, of course, agile software development method adoption. Ralph Hughes, chief systems architect for Ceregenics and I will be speaking on this topic on September 20 at the upcoming TDWI World Conference in Boston. If you would like to hear a preview of what we will be talking about, including the ongoing research effort into use of agile methods, listen to our recent Webinar.
Achieving greater agility through better methods and technology is a hot area of interest in the TDWI community. Let us know your views on this important topic, both by taking the research survey and by getting in touch.
Posted by David Stodder0 comments
By Philip Russom, TDWI Research Director
[NOTE: The following article was published in the TDWI Trip Report of May 2012.]
The Technology Survey that TDWI circulated at the recent World Conference in Chicago asked attendees to answer a few questions about analytic database management systems and how these fit into their overall data warehouse architecture. Here’s some background information about analytic databases, plus a sampling of attendees’ responses to the survey:
A “database management system” (DBMS) is a vendor-built enterprise-class software package designed to manage databases, whereas a “database” is a collection of data managed by a DBMS. Hence, an “analytic DBMS” (ADBMS) is a vendor-built DBMS designed specifically for managing data for analytics. ADBMSs are most often optimized for “Extreme SQL,” which involves complex queries that scan terabytes of data or routines that may include thousands of lines of SQL. SQL aside, some ADBMSs support other in-database analytic processing, such as MapReduce, no-SQL parsing methods, and a variety of user-defined functions for data mining, statistical analysis, natural language processing (NLP), and so on. Some vendors package or market their ADBMSs as data warehouse appliances, columnar DBMSs, analytic accelerators, in-memory DBMSs, and cloud/SaaS-based platforms.
Half of organizations surveyed (52%) have no ADBMS. There are good reasons why some organizations don’t feel the need for a specialized analytic DBMS. (See Figure 1.) Many organizations stick close to reporting, OLAP, and performance management, for which the average enterprise data warehouse (EDW) is more than capable. Others simply haven’t matured into the use of advanced analytics, for which most ADBMSs are designed. Still others have a powerful EDW platform that can handle all data warehouse workloads, including those for advanced analytics. Among the half of respondents that do have one or more ADBMSs, most have between one and five; multiple ADBMSs can result when multiple analytic methods are in use, due to diverse business requirements for analytics. Also, analytics tends to be departmental by nature, so ADBMSs are commonly funded via departmental budgets; and multiple departments investing in analytics leads to multiple ADBMSs.
FIGURE 1. Based on 75 respondents. Approximately how many standalone ADBMS platforms has your organization deployed? 52% = Zero
37% = One to five
8% = Six to ten
3% = More than ten
Half of organizations surveyed (46%) run analytic workloads on their EDW. The EDW as a single monolithic architecture is still quite common, despite the increasing diversity of data warehouse workloads for analytics, real-time, unstructured data, and detailed source data. (See Figure 2.) Even so, a third of respondents (34%) offload diverse workloads to standalone DBMSs (often an ADBMS), typically to get workload-specific optimization or to avoid degrading the performance of the EDW. If you compare Figures 1 and 2, you see that half of respondents don’t have an ADBMS (Figure 1) because they run analytic workloads on their EDW (Figure 2).
FIGURE 2. Based on 74 respondents. Which of the following best characterizes how data warehouse workloads are distributed in your organization? 46% = One monolithic EDW that supports all workloads in a single DBMS instance
34% = One EDW, plus multiple, standalone DBMSs for secondary workloads
20% = Other
Most respondents consider an ADBMS to be a useful complement to an EDW. Even some users who don’t have an ADBMS feel this way. (See Figure 3.) According to survey results, an ADBMS provides analytic and data management capabilities that complement an EDW (56%), enables the “analytic sandboxes” that many users need (57%), and optimizes more analytic workloads than the average EDW (58%).
FIGURE 3. Based on 219 responses from 72 respondents. What are the potential benefits of complementing an EDW with an ADBMS? (Select all that apply.)
58% = Optimized for more analytic workloads than our EDW
57% = Enables the “analytic sandboxes” that many users need
56% = Provides analytic and data mgt capabilities that complement our EDW
46% = Isolates ad hoc analytic work that might degrade EDW performance
33% = Manages multi-Tb raw source data for analytics better than EDW
29% = Handles real-time data feeds for analytics better than EDW
22% = Takes analytic processing to Big Data, instead of reverse
3% = Other
Posted by Philip Russom, Ph.D.0 comments
By Philip Russom, TDWI Research Director
High performance continues to intensify as a critical success factor for user implementations in data warehousing (DW), business intelligence (BI), data integration (DI), and analytics. Users are challenged by big data volumes, new and demanding analytic workloads, growing user communities, and business requirements for real-time operation. Vendor companies have responded with many new and improved products and functions for high performance—so many that it’s hard for users to grasp them all.
In other words, just about everything we do in DW, BI, DI, and analytics has some kind of high-performance requirement. Users want quick responses to their queries, analysts need to rescore analytic models as soon as possible, and some managers want to refresh their dashboards on demand. Then there’s scalability, as in the giant data volumes of big data, growing user communities, and the overnight refresh of thousands of reports and analyses. Other performance challenges come from the increasing adoption of advanced analytics, mixed workloads, streaming data, and real-time practices such as operational BI.
Across all these examples, you can see that high-performance data warehousing (HiPerDW) is all about achieving speed and scale, despite increasing complexity and concurrency. This applies to every layer of the complex BI/DW/DI technology stack, as well as processes that unfold across multiple layers.
Luckily, today’s high-performance challenges are being addressed by numerous technical advancements in vendor tools and platforms. For example, there are now multiple high-performance platform architectures available for your data warehouse, including MPP, grids, clusters, server virtualization, clouds, and SaaS. For real-time data, databases and data integration tools are now much better at handling streaming big data, service buses, SOA, Web services, data federation, virtualization, and event processing. 64-bit computing has fueled an explosion of in-memory databases and in-memory analytic processing in user solutions; flash memory and solid-state drives will soon fuel even more innovative practices. Other performance enhancements have recently come from multi-core CPUs, appliances, columnar storage, high-availability features, MapReduce, Hadoop, and in-database analytics.
My next Best Practices Report from TDWI will help users understand new business and technology requirements for high-performance data warehousing (HiPerDW), as well as the many options and solutions available to them. Obviously, performance doesn’t result solely from the data warehouse platform, so the report will also reach out to related platforms for analytics, BI, visualization, data integration, clouds, grids, appliances, data services, Hadoop, and so on. My upcoming TDWI report (to be published in October 2012) will provide tips and strategies for prioritizing your own adoption of high-performance features.
Please help me with the research for the HiPerDW report, by taking its survey, online at:
http://svy.mk/HiPerDW. And please forward this email to anyone you feel is appropriate, especially people who have experience implementing or optimizing the high performance of systems for BI/DW/DI and analytics. If you tweet about HiPerDW, please use the Twitter hash tag #HiPerDW. Thank you!
Posted by Philip Russom, Ph.D.0 comments
By Philip Russom
Before January runs out, I thought I should tender a few prognostications for 2012. Sorry to be so late with this, but I have a demanding day job. Without further ado, here are a few trends, practices, and changes I feel we can expect in 2012.
Big data will get bigger. But, then, you knew that. Enough said.
The connection between big data and advanced analytics will get even stronger. My base assumption is that advanced analytics has become such an important priority for user organizations that it’s influencing most of what we do in business intelligence (BI), data warehousing (DW), and data management (DM). It even influences our attitudes toward big data. After all, the current frenzy – which will become more operationalized than ad hoc in 2012 – is to apply advanced analytic techniques to big data. In other words, don’t do one without the other, if you’re a BI professional.
From problem to opportunity. The survey for my recent TDWI report on Big Data Analytics shows that 70% of organizations already think of big data as an asset to be leveraged, largely through advanced analytics. In 2012, the other 30% will come around.
From hoarding to collecting. As a devotee of irony, I’m amused to see reality TV shows about collectibles and hoarding run back-to-back. Practices lauded in the former are abhorred in the latter, yet the line between collecting and hoarding is a thin one. Big data is a case in point. Many organizations have hoarded Web logs, RFID streams, and other big data sets for years. The same organizations are now turning the corner into collecting these with a dedicated purpose, namely analytics.
Advanced analytics will become as commonplace as OLAP. Okay, I admit that I’m exaggerating for dramatic effect. But, I have to say that big data alone has driven many organizations beyond OLAP into advanced forms of analytics, namely those based on mining, statistics, complex SQL, and natural language processing. This trend has been running for almost five years; there may be another five in it.
God is in the details. Or is the devil in the details? I guess it depends on what we’re talking about. With big data analytics, expect to see far more granular detail than ever before. For example, most 360-degree customer views today include hundreds of customer attributes. Big data can bump that up to thousands of attributes, which in turn provides greater detail and precision for customer-base segmentation and other customer analytics, both old and new.
Multi-structured data. Are you as sick of the “structured data versus unstructured data” comparison as I am? This tired construct doesn’t really work with big data, because it’s often a mix of structured, semi-structured, and unstructured data, plus gradations among these. I like the term “multi-structured data” (which I admit that I picked up from Teradata folks) because the term covers the whole range and it reminds us that big data is often a kind of mashup. To get full business value out of big data through analytics, more user organizations will invest in people skills and tools that span the full range of multi-structured data.
You will change your data warehouse architecture. At least, you will if you’re truly satisfying the requirements of big data analytics. Let’s be honest. Most EDWs are designed and optimized by their technical users for reporting, performance management, OLAP, and not much else. This is both a user design issue and a vendor platform issue. In recent years, I’ve seen tons of organizations rearchitect their EDWs (and sometimes swap platforms) to accommodate massive big data, multi-structured data, real-time big streams, and the demanding workloads of advanced analytics. This painful-but-necessary trend is long from over.
I’m stopping here because I’ve reached my target word count. And my growling stomach says it’s lunch time. But you get the idea. The business value of advanced analytics and the nuggets to be mined from big data have driven a lot of change recently, and will continue to do so throughout 2012.
SUGGESTED READING:
For a detailed discussion, see the TDWI Best Practices Report, titled
Big Data Analytics, which is available in a PDF file via a free download.
You can also replay my
TDWI Webinar, where I present the findings of the Big Data Analytics report.
For a discussion of similar issues, download the TDWI Checklist Report, titled
Hadoop: Revealing Its True Value for Business Intelligence.
And you can replay last month’s
TDWI Webinar, in which I led a panel of vendor representatives in a discussion of Hadoop and related technologies.
Philip Russom is the research director for data management at TDWI. You can reach him at
[email protected] or follow him as @prussom on Twitter.
Posted by Philip Russom, Ph.D.0 comments
Happy New Year to everyone in the TDWI community! I wish you an enjoyable and prosperous year. Squinting down the path ahead, it is indeed going to be a busy year at TDWI as we roll out our World Conferences, Summits, Forums, Seminars, Webinars, Best Practices Reports, Checklists, and more. The next World Conference is coming up February 12-17, in Las Vegas. This event is always one of the major gatherings of the year in business intelligence and data warehousing, and I am looking forward to being there and interacting with attendees, exhibitors, TDWI faculty, and a few croupiers here and there.
In Las Vegas I will be helping out my colleague, Philip Russom, who is chairing the BI Executive Summit, February 13-15. This conference has a theme of “Executing a Data Strategy for Your Enterprise” and will feature a great selection of case studies, expert speakers, and panel sessions. Check out the program to see if this event is important for you to attend.
In Vegas and throughout many of our conferences this year, you will have the chance to learn about big data analytics, which is a big topic for TDWI. Big data is getting increasing airplay in the mainstream media, as evidenced by this recent New York Times column by Thomas Friedman (read down a bit, to the fifth paragraph, past the political commentary). Friedman points out that big data could be the “raw material for new inventions in health care, education, manufacturing, and retailing.” We could not agree more, and are focused on enabling organizations to develop the right technology and data strategies to achieve their goals and ambitions with big data in 2012.
Coming up for me on January 11 is a Webinar, “Mobile Business Intelligence and Analytics: Extending Insight to a Mobile Workforce.” This is coordinated with the just-published Best Practices Report of the same name that I authored. The impact of mobile devices, particularly tablets, on BI and analytics made nearly everyone’s list of key trends in 2012, and with good reason. The potential of mobile devices is exciting for furthering the “right data, right users, right time” goals of many BI implementations. Executives, managers, and frontline employees in operations such as customer sales, service, and support have clear needs for BI alerts, dashboard reports, and capabilities for drill-down analysis while on the go. There are many challenges from a data management perspective, so organizations need to examine carefully how, where, and when to enable mobile BI and analytics. I hope the report provides food for thought and perspectives that are helpful in making decisions about mobile.
I expect that this will be an exciting year in our industry and look forward to blogging about it as we go forward into 2012.
Posted by David Stodder0 comments
Blog by Philip Russom
Research Director for Data Management, TDWI
Just moments ago, Teradata Corporation issued three announcements describing new capabilities, products, and releases. Instead of repeating the details of Teradata’s new stuff -- which you can read on www.teradata.com, etc. -- I’d rather be self-indulgent and use each announcement as a springboard for my own thoughts about the bigger trends in Big Data Analytics these relate to.
Announcement Number One: Teradata Columnar A few years ago, I was at the Teradata Partners Conference. Instead of attending speaking sessions, I was in a series of meetings for industry analysts and industry influencers. When the topic of columnar databases came up -- and it was my turn to pontificate -- I said something like: “Columnar storage engines will soon be available as just another feature of database management systems from larger, more established vendors.” The room fell quiet, and a cricket chirped in the background. Then, two experts mocked me, while Teradata people were noticeably mum. ;)
Does that make me a prescient visionary? No, not at all. I’ve just been paying attention for the last three decades, as one technology after the next is developed and proved by a small startup, then bought or built by one or more of the leading DBMS vendors. We’ve seen this trend played out with features for everything from security to parallel processing to OLAP to federation to in-memory databases. We’re now seeing the same trend with columnar data stores and other technologies for Big Data Analytics.
Newish vendors like ParAccel and Vertica -- and Sybase long before them -- have proved the usefulness and commercial potential of a columnar approach. Open source DBMSs MySQL and Infobright made similar contributions. In full compliance with the trend I’m describing, IBM and Oracle have released columnar storage engines they built, and now it’s Teradata’s turn. Teradata Columnar is a new capability of Teradata Database 14. What’s new here is that Teradata has integrated both columnar AND row-based tables, thereby making hybrid applications more feasible. All the above is goodness, regardless of vendor, because columnar data stores have compelling advantages for query speed, data compression, bla, bla, bla, and the usual miraculous benefits.
This recurring trend begs the question: What’s the next new innovation that’s on the path to DBMS assimilation? It’s obvious to me that Hadoop and MapReduce are already well down that path. And that brings us to the next Teradata announcement.
Announcement Number Two: Teradata Aster MapReduce Platform On the upside, MapReduce is the secret sauce that brings advanced analytic capability to a big data repository, whether it’s Hadoop’s file system or a relational database management system (RDBMS). On the downside, MapReduce from most sources is mired in hand-coding and devoid of SQL (to which we’re hand-cuffed in BI). Hence, MapReduce shows great promise for the world of BI, but only if it can evolve to suit the technical requirements of BI and DW professionals.
Evolving MapReduce is what the small vendor Aster Data Systems has always been about, and the evolution continues now that Teradata has acquired Aster. First, Aster showed that MapReduce could be effective with an RDBMS – at least, with its own nCluster database, now called Aster Database 5.0. Aster then showed that MapReduce and SQL can be reconciled, and they received a patent for their innovation in this realm.
Let’s shift gears and look at data warehouse appliances. Despite the term “data warehouse” in the name, these are really “big data analytics appliances.” I say this based on the fact that at least 90% of DW appliance owners use them for multi-terabyte analytics, not data warehousing. Aster is now showing that a MapReduce-based RDBMS can be suited to an appliance, as in the new Aster MapReduce Appliance based on Teradata hardware.
I’ll say more about the evolution of MapReduce in a TDWI Webinar on October 27. Please
register online and attend.
Announcement Number Three: Teradata Database 14
Most of the new functionality of Teradata Database 14 seems focused on making the system even more manageable and performable, especially in the context of multiple, diverse, concurrent data warehouse workloads.
The multiple workload problem is a thorny one. From the DW professional’s viewpoint, it’s not easy to optimize a data warehouse for several workloads; so most of EDWs are optimized for a short list of workloads. Since the primary deliverables of the average DW are reports (whether standard or dashboards) and OLAP, most EDW designers consciously decide to optimize for these. But that makes it difficult to add new workloads to a centralized enterprise data warehouse, so new workloads are often distributed to marts, operational data stores, and data staging areas outside the warehouse proper. Examples of “new workloads” include those for real time, detailed source data, non-structured data, and discovery or exploratory analytics (not OLAP).
How DW professionals and vendors are responding to the challenge of multiple workloads constitutes a trend. That’s because the responses affect data warehouse architecture, logical modeling, optimization, performance, platform selection, tool selection, selection of analytic methods, management strategies for big data, and so on.
Note that the multiple workload challenge is both a user design issue and a vendor platform capability issue. Yet, I think the former can win out over the latter. A good design on a weak platform can succeed, though you’ll probably end up with a heavily distributed DW architecture. Conversely a bad design on a strong platform can fail, especially if you expect the platform to be the design. Technology and design issues aside, I must also point out that the placement of a DW workload can be influenced by organizational issues, like sponsorship, funding, and compliance.
So, what do you think? Let me know!
===============================
Want to learn more about Big Data Analytics? Attend the TDWI Forum on Big Data Analytics for Business Insight. There's more information online.
Posted by Philip Russom, Ph.D.0 comments