Blog by Philip Russom
Research Director for Data Management, TDWI
While researching a new TDWI report on big data analytics, I’ve run across a few BI professionals who are concerned about the seeming lack of data preparation that’s common with some forms of advanced analytics. Allow me a moment to sort this out.
On the one hand, all of us in BI and data warehousing are indoctrinated to believe that the data of an enterprise data warehouse (EDW) (and hence the data that feeds into reports) must be absolutely pristine, integrated and aggregated properly, well-documented, and modeled for optimization. To achieve these data requirements, BI teams work hard on extract, transform, and load (ETL), data quality (DQ), meta and master data management (MDM), and data modeling. These data preparation best practices make perfect sense for the vast majority of the reports, dashboards, and OLAP-based analyses that are refreshed from data warehouse data. For those products of BI, we want to use only well-understood data that’s brought as close to perfection as possible. And many of these become public documents, where problems with data could be dire for a business.
On the other hand, preparing data for advanced analytics requires very different best practices – especially when big data is involved. The product of advanced analytics is insight, typically an insight about bottom-line costs or customer churn or fraud or risk. These kinds of insights are never made public, and the analytic data they’re typically based on doesn’t have the reuse and publication requirements that data warehouse data has. Therefore, big data for advanced analytics rarely needs the full brace of ETL, data quality, metadata, and modeling we associate with data from an EDW.
In fact, if you bring to bear the full arsenal of data prep practices on analytic datasets, you run the risk of reducing its analytic value. This is ironic, because we usually think of ETL, DQ, and data modeling as adding value to data, not subtracting it. So, how can they harm analytic data?
To answer that question, let’s first take a look at so-called “advanced analytics.” This collection of analytic techniques would be better called “discovery analytics,” because that’s what users do with it. A business analyst or similar user applies techniques like data mining, statistical analysis, complex SQL, MapReduce, and natural language processing to discovery facts about the business that no one knew before. For example, you might discover the root cause of the latest form of customer churn. Or you might find a cluster of transactions that indicate a new kind of fraud. Or you could stumble onto an untapped customer segment.
In general, you can’t discover those entities and facts from the overly studied, calculated, modeled, and aggregated data of an EDW. Instead, you need big data, with lots of granular detail, typically in the schema of the source systems it came from. Some forms of analytics actually thrive on questionable data in poor condition. For example, analytic applications for fraud detection may depend on outliers and non-standard data as indications of fraud. And the insights of discovery analytics often focus in narrow slices of the business, like an obscure customer segment, or time frame or group of shipments or transaction types or risky neighborhood. These thin slices can easily disappear in an aggregation pass. Hence, if you apply ETL and DQ processes to big data, as you do for a data warehouse, you run the risk of stripping out the very nuggets that make big data a treasure trove for discovery oriented advanced analytics. This is why the preparation of data for discovery analytics seems minimal (even slipshod) – often just extracts and table joins – compared to the full range of data prep applied to EDW data.
Does this mean that we can throw out the sacrosanct best practices for ETL, DQ, metadata, MDM, and data modeling? No, of course not. Some organization will simply need to suspend these for discovery analytics with big data—but only temporarily. Here’s a typical scenario.
After business analysts and other users have discovered what they’re looking for in big data, they need to take the discovery to the BI and DW team, so the results can be “institutionalized” in the EDW. For example, when discovery analytics reveals valuable items – like new forms of churn, customer segments, cost centers, etc. – these need to be represented by data structures in the EDW and reports, so that business people can track them regularly. At that point, the best practices of data preparation come back into play.
So, what do you think, folks? Let me know. Thanks!
Posted by Philip Russom, Ph.D.0 comments
Blog by Philip Russom
Research Director for Data Management, TDWI
A few weeks ago, I talked with Mike Eacrett, the vice president of product management for SAP HANA at SAP Labs. Among other things, Mike explained the “secret sauce” that gives SAP HANA flexibility and performance for big data analytics. Give me a moment to recount Mike’s explanation.
Philip Russom
: What forms of analytics are you seeing on the rise with SAP customers?
Mike Eacrett
: SAP customers continue to expand their investments in online analytic processing (OLAP). But the explosive growth is with exploratory analytics. That’s where a business user needs to learn things that he/she didn’t know to ask before. Or they need to see patterns or the absence of them in the data, typically in response to a change in the business or customer behavior. This kind of exploration requires big data, typically in its original source schema with all its details intact. Instead of transforming and cleansing the data prior to analysis (which can lose desirable data details), the user iteratively develops queries that manipulate data at the analytic tool level, not the physical storage level, as you would when, say, modeling a data warehouse.
Philip Russom
: I’m familiar with this analytic method, so I know that it requires a hefty platform for big data analytics. What is SAP offering in this regard?
Mike Eacrett
: We offer the SAP In-Memory Computing Appliance, otherwise known as SAP HANA. It’s an enterprise software architecture that enables analytic queries to run against detailed source data—and run fast in real time—without need for transforming the data into data models optimized for a specific type of analysis. To achieve this, SAP HANA implements its own massively parallel distributed processing method (similar to some of the concepts of MapReduce), based on HANA’s in-memory database, running code that utilizes the instruction set and vector processing capabilities of Intel chip sets. That means that the SAP user needn’t define analytic queries months in advance, then wait for IT to model data for them. All the data is available at their fingertips in memory. HANA gives logical data modeling a new twist, so that the analyst user can run queries as fast as he or she thinks them up, and without being limited by data models, data movement, and pre-aggregation constraints.
Philip Russom
: You mentioned that SAP HANA gives logical data modeling a new twist. What do you mean?
Mike Eacrett
: The term for this new technique is “logical data marting.” It assumes that all the operational source data needed for analytics present in SAP modules is also available in SAP HANA. A logical data model of a data mart is constructed in server memory, based on an analytic query that’s being executed. In SAP HANA-based applications, the same data model is used for online transactional (OLTP) and analytics – in other words, the data marts are a logical view of one persistence layer. The logical model draws data from modules’ underlying memory persisted tables, as needed by queries. As an analyst or HANA-based application iteratively redefines a query, the model automatically redraws itself, using analytic and calculation views. The logical model (based on queries against the pre-built SAP business content) liberates analysts from cumbersome data modeling, and the in-memory processing gives it true real-time speed.
So, what do you think, folks? Let me know. Thanks!
Posted by Philip Russom, Ph.D.0 comments
Blog by Philip Russom, Research Director for Data Management, TDWI
I recently had a great phone conversation with Mike Olson, the CEO of Cloudera. Mike has a gift for explaining new and complex technologies and their emerging best practices. Let me share a few of Mike’s insights.
Philip Russom: My understanding is that Cloudera makes a business by distributing open source software, namely MapReduce-based Apache Hadoop. Is that right?
Mike Olson: Well, that’s part of it. Cloudera does a lot more than simply distribute open source Hadoop. We make Hadoop viable for serious enterprise users by also providing technical support, upgrades, administrative tools for Hadoop clusters, professional services, training, and Hadoop certification. Furthermore, our distribution package of Hadoop includes more than Hadoop. So Cloudera collects and develops additional components to strengthen and extend Hadoop.
Philip Russom: So, what is Hadoop?
Mike Olson: Essentially there are two pieces in Hadoop. First, there’s the Hadoop Distributed File System (or HDFS), which can manage big data on clusters of many nodes. Our customers typically start with twenty nodes or so, then quickly grow to fifty or more. Some of our customers have thousands of nodes, managing petabytes of data. A many-node cluster enables big data management, plus other nice benefits like scalability, performance, and high availability. But the ramification is that data is heavily distributed.
That’s where the second piece comes in, namely MapReduce. Thanks to this capability of Hadoop, you can define a data operation--like a query or analysis--and the platform ‘maps’ the operation across all relevant nodes, for distributed processing and data collection. The platform then consolidates and reduces the responses that come back. Due to the distributed processing of MapReduce, analytics against very big data is possible—and with good performance.
Philip Russom: What kind of analytics?
Mike Olson: Hadoop excels in discovering patterns in big data, patterns that you didn’t know were there, in data that you probably don’t know very well. That makes Hadoop the opposite of your average data warehouse query against well-understood relational data. Since Hadoop and a traditional data warehouse are complementary, putting them together gives you a very broad range of business intelligence capabilities.
Philip Russom: What data types and data models are your customers managing?
Mike Olson: In Hadoop, you can mix and match data types to your heart’s content. Hadoop will store anything without requiring a data type declaration. Also, Hadoop is amazingly tolerant of messy data. For example, our customers manage any kind of file you can think of in the HDFS, and these can have just about any kind of data model. This also includes human language text and complex data types. So, big data’s not just big. It’s also highly diverse and complicated. And Hadoop excels in handling data of such extreme size, diversity, and complexity for the purposes of analytics.
So, what do you think, folks? Let me know. Thanks!
Posted by Philip Russom, Ph.D.0 comments
Teradata’s recent acquisition of Aster Data Systems is a huge signal that worlds of “big data” and data warehousing are coming together. The deal itself was not a surprise; Teradata made a down payment on Aster last September, when it bought 11 percent of the company. And before making that initial investment, Teradata proved that it was not averse to bringing in other people’s database engines by acquiring Kickfire, an innovator in MySQL and analytic appliances. However, unlike Kickfire, which was floundering in the market but offered interesting “SQL on a chip” technology, Aster was successful and well-funded. Teradata will now have an opportunity to expand its appeal beyond traditional, SQL-based data warehousing into the realm of particularly unstructured big data – and provide the technology to bring these worlds together.
“Big data” refers to the massive volumes of structured and unstructured data being generated by relatively new data sources such as Web and smart phone applications, social networks, sensors and robots, GPS systems, genomics and multimedia. For customer interaction, fraud detection, risk management and other purposes, it is often vital to analyze this data in something close to real time so that decision makers can be aware of events, trends and patterns for immediate response or predictive understanding.
The extreme requirements brought on by big data have accelerated the technology shift toward massively parallel processing (MPP) systems, which generally offer better speed and scale for the size and workloads involved in big data analysis compared with traditional symmetric multiprocessing (SMP) systems. TDWI survey data shows that data warehouse professionals intend to abandon SMP in favor of MPP. Not surprisingly, MPP’s growing appeal was a driver behind the market explosion in recent years of new data management systems and appliances that could take advantage of parallelism. Now, that market is consolidating; EMC bought Greenplum, IBM bought Netezza, HP bought Vertica and now Teradata has picked up Aster. And during this period, we’ve seen Oracle introduce Exadata, IBM introduce its Smart Analytics Systems and other developments that are bringing MPP into the mainstream for advanced analytics.
To take advantage of MPP for big data, many developers, particularly at Google, Yahoo! and other firms that bet their business on analysis of online data, have chosen to look beyond SQL, the lingua franca of relational databases, and implement Hadoop and MapReduce, which offer programming models and tools specifically for building applications and services that will run on MPP and clustered systems. Aster, with its nCluster platform, has strongly supported MapReduce implementations; as part of its “universal query framework” introduced with the 4.6 release of nCluster last fall, Aster released SQL-MapReduce to support a wider spectrum of applications.
My colleague at TDWI Research, Philip Russom, notes that while there are many synergies between Teradata and Aster – the technologies from both companies are fully capable of handling extreme big data and both assume use cases involving both big data and analytics – there are significant differences. “Teradata is designed for data that’s ruthlessly structured, even third normal form, whereas Aster, especially with its recent support for Hadoop, is known for handling a far wider range of data types, models, and standards,” Philip noted. “Most Teradata users are data warehouse professionals who are hand-cuffed to SQL, whereas Aster’s user base includes lots of application developers and other non-warehouse folk who are more interested in Pig and Hive. It’s a good thing that having diversity is strength. Assuming the Teradata and Aster camps can overcome their differences, they have a lot of great things to learn from each other.”
TDWI members have been ramping up use of advanced analytics against multi-terabyte data sets for the last several years, and Teradata platforms have been in the middle of that trend. Teradata’s move gives data warehouse professionals a strong reason to evaluate whether Aster’s technology can enable them to further exploit the power of MPP for both SQL and non-SQL applications that require advanced analytics of big data.
Stay tuned to TDWI for more insight into how organizations can expand data warehousing into the realm of big data. We are in the planning stages now for our TDWI Solution Summit, “Deep Analytics for Big Data,” to be held in San Diego, September 25-27.
Posted by David Stodder0 comments

I transcended time and space earlier this week when I attended Hadoop World in New York City.
It started Monday evening. After taking a high-speed train from Boston, I emerged from the bowels of Penn Station onto the bright lights and bustling streets of mid-town Manhattan. The pavement was wet from a passing rain and lightening pulsed in the distant sky, framed by the city’s cavernous skyscrapers. I felt like I had entered a Hollywood set for an apocalyptic movie. But that was just the beginning.
Invigorated by the city’s pulsing energy, I decided to walk 15 blocks to my hotel. Halfway there, the winds picked up, the muted lightening roared to life, and rain scoured the streets in endless waves. I ducked under a large hotel canopy just in time to see hail the size of shooter marbles pelt everything in sight. After 15 minutes, the deluge subsided. But by the time I reached my hotel, I was soggy and stunned.
Welcome Aboard!
The next morning, as I listened to the proceedings from Hadoop World, I realized that the prior night’s surreal weather was a fitting prelude to the conference—at least for me. Hadoop World was a confab for programmers—almost 1,000 of them. As a data guy, it felt like I had been transported to parallel universe where the people looked and acted the same but spoke a completely different language. But what I did understand, I liked.
With Hadoop, it seems that the application community finally discovered data and its potential to make businesses smarter. “Hadoop is a high value analytics engine for today’s businesses,” said Mike Olson, during his kickoff keynote. Mike is CEO and Founder of Cloudera, an open source provider of Hadoop software and services and host of the event. Following Olson on the stage was Tim O’Reilly, founder of O’Reilly Media, a long-time high-tech luminary and open source proponent. He said, "We are the beginning of an amazing world of data-driven applications. It's up to us to shape the world."
It was wonderful to see the developer community discover data in all its glory. To my fellow developers, I say, “Welcome aboard!” We’re all on the same page now.
Fathoming Hadoop
Hadoop is one of the first attempts by the developer community to get their arms around data in a way that conforms to their skills, knowledge, and culture. From a data guy’s perspective, Hadoop is clunky, slow, and woefully immature. But it does have advantages. As a result, it’s already popping up in corporate data environments as a complement to analytical databases. For example, some leading-edge companies are using Hadoop to process and store large volumes of clickstream and sensor data that they then feed into analytical databases for query processing.
So what is Hadoop? It might be easier to say what it's not.
· Hadoop is not a database; it’s a distributed file system (Hadoop Distributed File System or HDFS) that scales linearly across commodity servers. It is also a programming model (MapReduce) that enables developers to build applications in virtually any language they want and run them in parallel across large clusters.
· Hadoop is not a transactional system; it’s a batch-oriented system that runs hand-crafted Map-Reduce programs. You are not going to run iterative queries in Hadoop.
· Hadoop does not support random data access; it reads and writes all data sequentially, which makes it tortuously slow for tactical updates and queries and mixed workload applications.
Today, Hadoop shines as an infinitely scalable data processing environment for handling huge volumes of data that would be prohibitively expensive to store and analyze in a traditional relational database or even a data warehousing appliance. Hadoop lets companies capture and store all their data—structured, semi-structured, and unstructured—without having to archive or summarize the data. Consequently, some companies, such as Comscore and CBS Interactive, use Hadoop as a massive staging area to capture, store, and prepare large volumes of data for delivery to downstream analytic structures.
The main advantages of Hadoop are:
1. Open Source. The software is free. And free is good compared to spending millions of dollars on a relational database to handle tens of terabytes to petabytes of data (if it can.) You can download individual components from the Apache Software Foundation, or purchase a “distribution” from third party providers, such as Cloudera or IBM. A distribution is a package of Hadoop-related applications that are tested to ensure compatibility and stability and delivered with support and professional services on a subscription basis.
2. Linear Scalability. Hadoop is an MPP system that runs on commodity servers. It scales linearly as you add more servers. It has minimal overhead compared to relational databases so it offers superior scalability.
3. Streaming. Hadoop is a file system that does not require specialized schema or normalization to capture and store data or a special language to access it. Therefore, Hadoop makes it possible to perform (high-speed) reads and writes. In addition, a new application called Flume lets Hadoop consume streaming event data. In other words, it’s easy to get large volumes of data in and out of Hadoop.
4. Unstructured data. Because of its schema-less design, Hadoop and MapReduce work well on any type of data. MapReduce interprets data at run time based on the keys and values defined in the MapReduce program. Thus, a developer can design the program to work against structured, semi-structured, or even unstructured data, such as images or text.
5. Minimal Administration. Hadoop automatically handles node failures, making it easy to administer large clusters of machines and write parallelized programs that run against the cluster.
The Future of Hadoop
We are in the early days of Hadoop. There is a tremendous amount of excitement and energy around the initiative. The open source community is innovating quickly and bringing to market new capabilities that make Hadoop more database-like and a better partner in corporate data centers. For example, the community has introduced Hive, a SQL-like language that generates MapReduce programs under the covers and makes Hadoop appear more like a relational engine. It has also released Pig, a dataflow language that makes it easier to create MapReduce transformation logic than writing low-level Java.
Conversely, some BI vendors are adopting elements of Hadoop. For example, database vendors, such as Aster Data and Greenplum, have added support for MapReduce. And many relational database and ETL vendors, such as Pentaho and Talend, have implemented or announced bidirectional interfaces for moving data in and out of Hadoop. In addition, BI vendors, led by DataMeer, are working on JDBC interfaces to Hadoop so users can execute reports and queries against Hadoop from the confines of their favorite BI tool. Expect a slew of announcements this year from the likes of MicroStrategy, SAP BusinessObjects, IBM Cognos, and others supporting Hadoop.
It's clear that we’ve entered the era of big data analytics. And frameworks, such as Hadoop, are helping to advance our ability to generate valuable insights from large volumes of data and new data types. Just as exciting, the developer and data communities are converging to address large-scale data issues. And while our language and approaches may differ, it won’t be long before we all sing the same tune with the same words.
0 comments
As a parent, by the time you have your second or third child, you know which battles to fight and which to avoid. It’s time we did the same in business intelligence (BI). For almost two decades we’ve tried to shoehorn both casual users and power users into the same BI architecture. But the two don’t play nicely together. Given advances in technology and the explosion in data volumes and types, it’s time we separate them and create dual BI architectures.
Mapping Architectures
Casual users are executives, managers, and front-line workers who periodically consume information created by others. They monitor daily or weekly reports and occasionally dig deeper to analyze an issue or get details. Generally, a well-designed interactive dashboard or parameterized report backed by a data warehouse with a well-designed dimensional schema is sufficient to meet these information needs. Business users who want to go a step further and build ad hoc views or reports for themselves and peers—whom I call Super Users—are best served with a semantic layer running against the same data warehouse.
Power users, on the other hand, explore data to answer unanticipated questions and issues. No predefined dashboard, report, or semantic layer is sufficient to meet their needs. They need to access data both in the data warehouse and outside of it, beyond the easy reach of most BI tools and predefined metrics and entities. They then need to dump the data into an analytical tool (e.g. Excel, SAS) so they can merge and model the data in novel and unique ways.
For years, we’ve tried to reconcile casual users and power users within the same BI architecture, but it’s a losing cause. Power users generate “runaway” queries that bog down performance in the data warehouse, and they generate hundreds or thousands of reports that overwhelm casual users. As a result, casual users reject self-service BI and revert back to old habits of requesting custom reports from IT or relying on gut feel. Meanwhile, power users exploit BI tools to proliferate spreadmarts and renegade data marts that undermine enterprise information consistency while racking up millions in hidden costs.
Time for a New Analytic Sandbox
Some forward-looking BI teams are now creating a separate analytic architecture to meet the needs of their most extreme power users. And they are relegating their data warehouses and BI tools to handle standard reporting, monitoring, and lightweight analysis.
Compared to a traditional data warehousing environment, an analytic architecture is much more free-form with fewer rules of engagement. Data does not need rigorous cleaning, mapping, or modeling, and hardcore business analysts don’t need semantic guardrails to access the data. In an analytic architecture, the onus is on the business analyst to understand source data, apply appropriate filters, and make sense of the output. Certainly, it is a “buyer beware” environment. As such, there may only be a handful of analysts in your company who are capable of using this architecture. But the insights they generate may make the endeavor well worth the effort and expense.
Types of Analytic Architectures
There are many ways to build an analytic architecture. Below are three approaches. Some BI teams implement one approach; others mix all three.
Physical Sandbox. One type of analytic architecture is uses a new analytic platform—a data warehousing appliance, columnar database, or massively parallel processing (MPP) database—to create a separate physical sandbox for their hardcore business analysts and analytical modelers. They offload complex queries from the data warehouse to these turbocharged analytical environments , and they enable analysts to upload personal or external data to those systems. This safeguards the data warehouse from runaway queries and liberates business analysts to explore large volumes of heterogeneous data without limit in a centrally managed information environment.
Virtual Sandbox. Another approach is to implement virtual sandboxes inside the data warehouse using workload management utilities. Business analysts can upload their own data to these virtual partitions, mix it with corporate data, and run complex SQL queries with impunity. These virtual sandboxes require delicate handling to keep the two populations (casual and power users) from encroaching on each other’s processing territories. But compared to a physical sandbox, it avoids having to replicate and distribute corporate data to a secondary environment that runs on a non-standard platform.
Desktop Sandboxes. Other BI teams are more courageous (or desperate) and have decided to give their hardcore analysts powerful, in-memory, desktop databases (e.g., Microsoft PowerPivot, Lyzasoft, QlikTech,Tableau, or Spotfire) into which they can download data sets from the data warehouse and other sources to explore the data at the speed of thought. Analysts get a high degree of local control and fast performance but give up data scalability compared to the other two approaches. The challenge here is preventing analysts from publishing the results of their analyses in an ad hoc manner that undermines information consistency for the enterprise.
Dual, Not Dueling Architectures
As an industry, it’s time we acknowledge the obvious: our traditional data warehousing architectures are excellent for managing reports and dashboards against standard corporate data, but they are suboptimal for managing ad hoc requests against heterogeneous data. We need dual BI architectures: one geared to casual users that supports standard, interactive reports and dashboards and lightweight analyses; and another tailored to hardcore business analysts that supports complex queries against large volumes of data.
Dual architectures does not mean dueling architectures. The two environments are complementary, not conflicting. Although companies will need to invest additional time, money, and people to manage both environments, the payoff is worth the investment: companies will get higher rates of BI usage among casual users and more game-changing insights from hardcore power users.
0 comments
Here’s a marriage made in heaven: combine search and business intelligence (BI) to create an easy-to-use query environment that enables even the most technophobic business users to find or explore any type of information. In other words, imagine Google for BI.
Search offers some compelling features that BI lacks: it has a brain-dead easy interface for querying information (i.e. the keyword search box made famous by Google and Yahoo); it returns results from a vast number of systems in seconds; and it can pull data from unstructured data sources, such as Web pages, documents, and email.
Of course, search lacks some key features required by BI users: namely, the ability to query structured databases, aggregate and visualize records in tabular or graph form, and apply complex calculations to base-level data. But imagine if you could build a system that delivers the best of both search and BI without any of the downsides?
Given the potential of such a union, a variety of vendors have been working for years to consummate the relationship. Some are search vendors seeking to penetrate the BI market; others are BI vendors looking to make good on the promise of self-service BI; and others are entrepreneurs who believe linguistic technology can bridge the gap between search and SQL.
Here are three approaches vendors are taking to blend search and BI technologies.
1. Faceted BI Search
Faceted BI search—for lack of a better term—is a pureplay integration of search and BI technologies. Information Builder’s Magnify is perhaps the best example of this approach, although Google has teamed up with several BI vendors to offer a search-like interface to structured data sources.
Here, a search engine indexes metadata and data generated by an ETL or reporting tool. When users type a word into the keyword search box, they receive a list of search results in the main body of the page and “facets” (i.e. categories of topics derived from metadata) in the left-hand column (see figure 1.) The results contain links to records in the source systems and reports that are executed on the fly using parameters from the search metadata. Users can also click on the facets to view subcategories and refine their search. Each time they click on a category or subcategory, a new set of result entries appear in the main body of the page.
Figure 1. Faceted Search
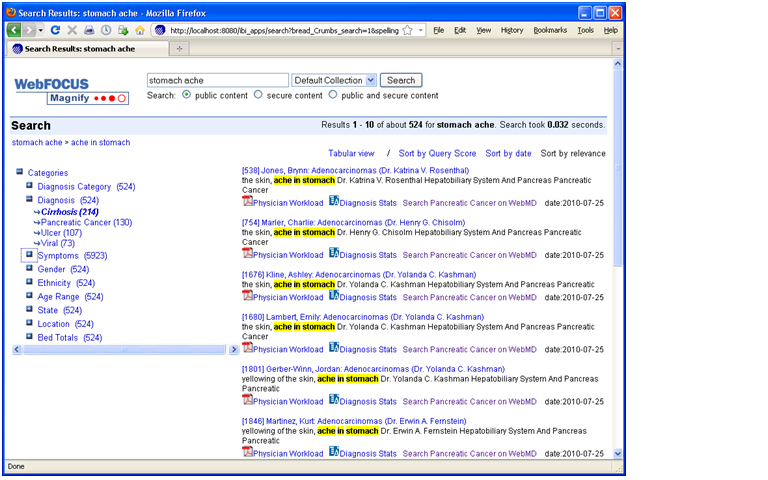
Information Builder, Inc.’s WebFocus Magnify is a BI Search product that indexes metadata and data generated by IBI’s ETL tool. The tool’s search engine displays search results in the main body of the page and dynamically generated “facets” or categories in the left-column. The search results contain links to reports that are dynamically generated based on search metadata. Source: Information Builders.
Prior to Faceted BI Search, comparable tools only indexed a BI vendor’s proprietary report files. So you could search for prerun reports in a specific format but nothing else. In contrast, Faceted BI Search dynamically generates reports based on search parameters. Furthermore, those reports can be interactive and parameterized, enabling users to continue exploring data until they find what they are looking for. In this dynamic, search becomes a precursor to reporting which facilitates exploration and analysis. So, the end user process flow is: searchàreportàexplore.
In addition, compared to prior generations of BI Search, Faceted Search indexes any content defined in metadata and fed to the search engine, including relational data, hierarchical data, documents, Web pages, and real-time events streaming across a messaging backbone. As such, the tools serve as surrogate data integration tools since they can mingle results multiple systems, including structured and unstructured data sources. It’s for this reason that in the past I’ve called Faceted Search a “poor man’s data integration tool.”
2. NLP Search
A more sophisticated approach to marrying search and BI involves natural language processing (NLP). NLP uses linguistic technology to enable a computer to extract meaning from words or phrases, such as those typed into a keyword search box. NLP breaks down the sentence structure, interprets the grammar and phrases, deciphers synonyms and parts-of-speech elements, and even resolves misspellings on the fly.
From there, the technology maps the meaning derived from keywords to metadata that describes the content of a database or document. Once this mapping occurs, the tools generate SQL queries against a database schema. All this happens instantaneously, so users can iteratively query a database using plain English rather than SQL or a complex query tool. (See figure 2.)
Figure 2. NLP Search
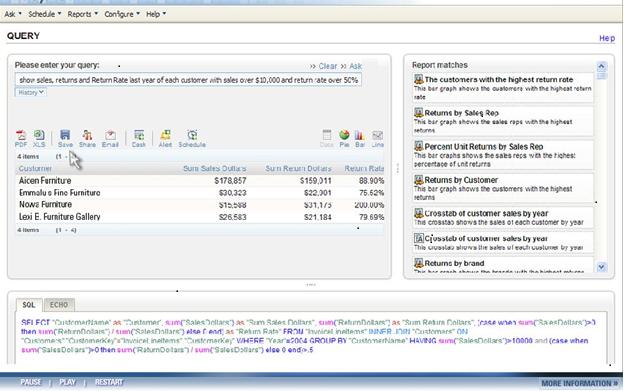
When users type a query in plain English into an NLP search box, the system suggests related reports (right pane) and hints (not shown) to refine the search. The system then maps the words to underlying database schema and generates SQL (bottom pane) which return the results (left pane), which can then be converted into a table, chart, or dashboard. Source: EasyAsk.
To make the translation between English words and phrases to SQL, the tools leverage a knowledgebase of concepts, business rules, jargon, acronyms, etc. that are germane to any business field. Most NLP tools come with knowledgebase for specific domains, including functional areas and vertical industries. Typically, NLP Search customers need to expand the knowledgebase with their own particular jargon and rules to ensure the NLP tools can translate words into SQL accurately. Often, customers must “train” a NLP Search tool on a specific database that it is going to query to maximize alignment.
While NLP tools may be a tad fussy to train and manage, they come closest to enabling users to query structured data sources. Ironically, despite their linguistic capabilities, the tools usually don’t query unstructured data sources since they are designed to generate SQL. Perhaps this limitation is one reason why pioneers in this space, EasyAsk and Semantra, have yet to gain widespread adoption.
3. Visual Search
The third approach doesn’t use search technology per se; rather, it mimics the effects of search using advanced BI tools. This type of BI Search runs a visualization tool directly against an analytic platform, usually an in-memory, columnar database with an inverted index that offers blindingly fast query performance. The combination of visualization and in-memory database tools enables users to explore sizable volumes at the speed of thought. Using a point and click paradigm, users can sort, filter, group, drill, and visual data. (See figure 3.)
Figure 3. Visual Search
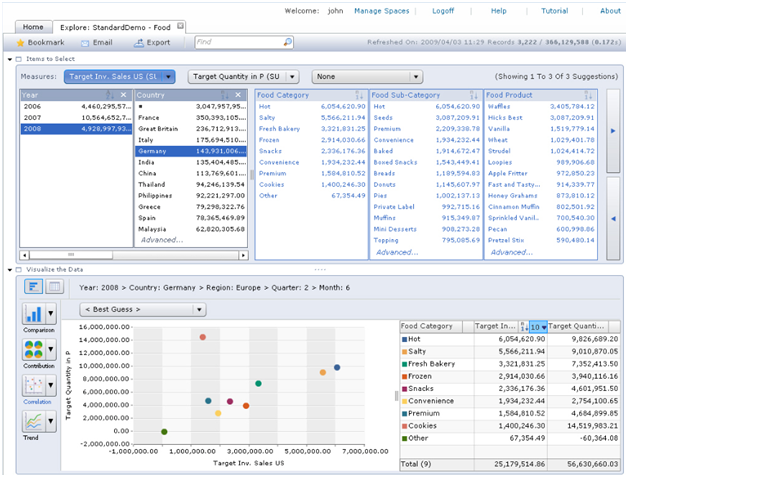
SAP BusinessObjects Explorer Accelerated marries a visualization tool with an analytic appliance (i.e., in-memory columnar database on an MPP machine) that enables users to “search” large volumes of data in an iterative manner. A user begins by typing a phrase into the keyword search box atop, which is used only to define the “information space” (i.e., the star schema) whose data will be exposed through the visual interface. Source: SAP.
Compared to Faceted BI search, which we described earlier, this approach eliminates the intermediate step of delivering individual search results or entries to users who then have to scan the entries to find one that is relevant and then click on a link to a related report. Instead, Visual Search links data directly to a visual analysis tool, giving users direct access to the information they are looking for along with the ability to dynamically interact with the data.
SAP BusinessObjects Explorer (and the recently announced Explorer Accelerated) and Endeca’s Information Access Platform are examples of Visual Search. While SAP BusinessObjects Explorer runs against star schema databases (primarily SAP BW InfoCubes today but heterogeneous databases in the near future), Endeca runs against both structured and unstructured data sources, which befits is origins as a search applications vendor.
Conclusion
BI Search is bound to gain traction in the BI market because it meets an unmet need: the ability to give casual users (i.e., executives, managers, and front-line workers) an ad hoc query tool that is simple enough to use without training.
Today, most self-service BI tools are too hard to use. And although a well-designed performance dashboard should meet 60% to 80% of the information needs of casual users, they don’t suffice for the other 20% to 40% of occasions when casual users need true ad hoc access to various information sources. Blending the best of search and BI technologies, BI search tools will fill this void.
Posted by Wayne Eckerson0 comments
Data federation is not a new technique. The notion of virtualizing multiple back-end data sources has been around for a long time, reemerging every decade or so with a new name and mission.
Database Gateways. In the 1980s, database vendors introduced database gateways that transparently query multiple databases on the fly, making it easier for application developers to build transaction applications in a heterogeneous database environment. Oracle and IBM still sell these types of gateways.
VDW. In the 1990s, vendors applied data federation to the nascent field of data warehousing, touting its ability to create “virtual” data warehouses. However, data warehousing purists labeled the VDW technology as “voodoo and witchcraft” and it never caught on, largely because standardizing disparate data from legacy systems was nearly impossible to do without creating a dedicated data store.
EII. By the early 2000’s, with more powerful computing resources, data federation was positioned as a general purpose data integration tool, adopting the moniker “enterprise information integration” or EII. The three-letter acronym was designed to mirror ETL—extract, transform, and load—which had become the predominant method for integrating data in data warehouses.
Data Services. In addition, the rise of Web services and services oriented architectures during the past decade gave data federation another opportunity. It got positioned as a data service, abstracting back-end data sources behind a single query interface. It is now being adopted by many companies that are implementing services oriented architectures.
Data Virtualization. Today, data federation vendors now prefer the label of data virtualization, capitalizing on the popularity of hardware virtualization in corporate data centers and the cloud. The term data virtualization reinforces the idea that data federation tools abstract databases and data systems behind a common interface.
Data Integration Toolbox
Over the years, data federation has gained a solid foothold as an important tool in any data integration toolbox. Companies use the technology in a variety of situations that require unified access to data in multiple systems via high-performance distributed queries. This includes data warehousing, reporting, dashboards, mashups, portals, master data management, SOA architectures, post- acquisition systems integration, and cloud computing.
One of the most common uses of data federation are for augmenting data warehouses with current data in operational systems. In other words, data federation enables companies to “real-time-enable” their data warehouses without rearchitecting them. Another common use case is to support “emergency” applications that need to be deployed quickly and where the organization doesn’t have time or money to build a data warehouse or data mart. Finally, data federation is often used to create operational reports that require data from multiple systems.
A decade ago there were several pureplay data federation vendors, but now the only independent is Composite Software, which is OEM’d by several BI vendors, including IBM Cognos. Other BI vendors support data federation natively, including Oracle (OBIEE) and MicroStrategy. And many data integration vendors, including Informatica and SAP have added data federation to their data integration portfolios.
Federation versus Integration
Traditionally, the pros and cons of data federation are weighed against those of data integration toolsets, especially when creating data warehouses. The question has always been “Is it better to build virtual data warehouses with federation tools or physical data marts and data warehouses with ETL tools?”
Data federation offers many advantages -- it’s a fast, flexible, low cost way to integrate diverse data sets in real time. But data integration offers benefits that data federation doesn’t: scalability, complex transformations, and data quality and data cleansing.
But what if you could combine the best of these two worlds and deliver a data integration platform that offered data federation as an integrated module, not a bolt on product? What if you could get all the advantages of both data federation and data integration in a single toolset?
If you could have your cake and eat it, too, you might be able to apply ETL and data quality transformations to real-time data obtained through federation tools. You wouldn’t have to create two separate semantic models, one for data federation and another ETL; you could use one model to represent both modalities. Basically, you would have one tool instead of two tools. This would make it easier, quicker, and cheaper to apply both data federation and data integration capabilities to any data challenge you might encounter.
This seamless combination is the goal of some data integration vendors. I recently did a Webcast with Informatica, which shipped a native data federation capability this year that runs on the same platform as its ETL tools. This is certainly a step forward for data integration teams that want a single, multipurpose environment instead of multiple, independent tools, each with their own architecture, metadata, semantic model, and functionality.
Posted by Wayne Eckerson0 comments
Analytic sandboxes are proving to be a key tactic in liberating business analysts to explore data while preventing the proliferation of spreadmarts and renegade data marts. Many BI teams already provide sandboxes of some sort, but few recognize that there are three tiers of sandboxes that can be deployed individually or in concert to meet the unique needs of every organization
Analytic sandboxes adhere to the maxim, “If you can’t beat them, join them.” They provide a “safe haven” for business analysts to explore enterprise data, combine it with local and external data, and then massage and package the resulting data sets without jeopardizing an organization’s proverbial “single version of truth” or adversely affecting performance for general DW users.
By definition, analytic sandboxes are designed for exploratory analysis, not production reporting or generalized distribution. Ideally, sandboxes come with an expiration date (e.g. 90 days), reinforcing the notion that they are designed for ad hoc analyses, not application development. If analysts want to convert what they’ve created into a scheduled report or application, they need to turn it over to the BI team to “productionize” it.
Unfortunately, analytic sandboxes can’t enforce information policies. Analysts can still export data sets to their desktop machines, email results to colleagues, and create unauthorized production applications. Ultimately, organizations that establish sandboxes must establish policies and procedures for managing information in a consistent manner and provide sufficient education about proper ways to produce and distribution information. Nonetheless, many BI teams are employing analytic sandboxes with reasonable success.
Tiers of Sandboxes
1. DW-Centric Sandboxes. The traditional analytic sandbox carves out a partition within the data warehouse database, upwards of 100GB in size, in which business analysts can create their own data sets by combining DW data with data they upload from their desktops or import from external sources. These DW-centric sandboxes preserve a single instance of enterprise data (i.e., they don’t replicate DW data), make it easier for database and DW administrators to observe what analysts are doing, and help analysts become more comfortable working in a corporate data environment. It’s also easier for the BI team to convert analyses into production applications since the analytic output is already housed in the DW.
However, a DW-centric sandbox can be difficult to manage from a systems perspective. Database administrators must create and maintain partitions and access rights and tune workload management utilities to ensure adequate performance for both general DW users and business analysts. An organization that has dozens or hundreds of analysts, each of whom wants to create large data sets and run complex queries, may bog down performance even with workload management rules in place. Inevitably, the BI team may need to upgrade the DW platform at considerable expense to support the additional workload.
2. Replicated Sandboxes. One way to avoid performance problems and systems management complexities is to replicate the DW to a separate platform designed exclusively for analysts. Many companies have begun to physically separate the production DW from ad hoc analytical activity by purchasing specialized DW appliances.
This approach offloads complex, ad hoc queries issued by a handful of people to a separate machine, leaving the production DW to support standardized report delivery, among other things. DW performance improves significantly without a costly upgrade, and analysts get free reign of a box designed exclusively for their use.
Of course, the downside to this is cost and duplication of data. Organizations must purchase, install, and maintain a separate database platform--which may or may not run the same database and server hardware as the DW. Executives may question why they need a separate machine to handle tasks they thought the DW was going to handle.
In addition, the BI team must establish and maintain a utility to replicate the data to the sandbox, which may take considerable expertise to create and maintain. The replication can be done at the source systems, the ETL layer, the DW layer (via mirrored backup), or the DW storage system. Also, with multiple copies of data, it’s easy for the two systems to get out of sync and for analysts to work with outdated information.
3. Managed Excel Sandboxes. The third tier of analytic sandbox runs on the desktop. New Excel-based analytical tools, such as Microsoft’s PowerPivot and Lyzasoft’s Lyza Workstation, contain in-memory columnar databases that run on desktop machines, giving analysts unheralded power to access, massage, and analyze large volumes of data in a manner that conforms to the way they’ve traditionally done such work (i.e., using Excel versus SQL.)
Although these spreadsheets-on-steroids seem like a BI manager’s worst nightmare, there is a silver lining: analysts who want to share their results have to publish through a server managed by corporate IT. This is why I call this type of sandbox a “managed Excel” environment.
For example, with Microsoft PowerPivot, analysts publish their results to Microsoft SharePoint, which makes the results available to other users via Excel Services, which is a browser-based version of Excel. Excel Services prevents users from changing or downloading the report, preventing unauthorized distribution. In the same way, Lyzasoft lets analysts publish data to the Lyza Commons, where others can view and comment on the output via browser-based collaborative tools.
Of course, where there is a will there is a way and business analysts can and will find ways to circumvent the publishing and distribution features built into PowerPivot and Lyza workbooks and other managed Excel environments. But the collaborative features of their server-based environments are so powerful and compelling that I suspect most business analysts will take the path of least resistance and share information in this controlled manner.
Combining Sandboxes. A managed Excel sandbox might work well in conjunction with the other two sandboxes, especially if the corporate sandboxes have performance or size constraints. For example, analysts could download a subset of data from a centralized sandbox to their managed Excel application, combine it with local data on their desktops, and conduct their analyses using Excel. If they liked what they discovered, they could then run the analysis against the entire DW within the confines of a centralized sandbox.
Our industry is in the early stages of learning how to make most effective use of analytic sandboxes to liberate power users without undermining information consistency. With three (and perhaps more) types of analytic sandboxes, BI teams can tailor the sandbox experience to meet the unique needs of their organization.
Posted by Wayne Eckerson0 comments
In her presentation on “BI Roadmaps” at TDWI’s BI Executive Summit last month, Jill Dyche explained that BI teams can either serve as “data providers” or “solutions providers.” Data providers focus on delivering data in the form of data warehouses, data marts, cubes, and semantic layers that can be used by BI developers in the business units to create reports and analytic applications. Solutions providers, on the other hand, go one step further, by working hand-in-hand with the divisions to develop BI solutions.
I firmly believe that BI teams must evolve into the role of solutions provider if they want to succeed long term. They must interface directly with the business, serving as a strategic partner that advises the business on how to leverage data and BI capabilities to solve business problems and capitalize on business opportunities. Otherwise, they will become isolated and viewed as an IT cost-center whose mission will always be questioned and whose budget will always be on the chopping block.
Data Provisioning by Default. Historically, many BI teams become data providers by default because business units already have reporting and analysis capabilities, which they’ve developed over the years in the absence of corporate support. These business units are loathe to turn over responsibility for BI development to a nascent corporate BI group that doesn’t know its business and wants to impose corporate standards for architecture, semantics, and data processing. Given this environment, most corporate BI teams take what they can get and focus on data provisioning, leaving the business units to weave gold out of the data hay they deliver.
Mired Down by Specialization
However, over time, this separation of powers fails to deliver value. The business units lose skilled report developers, and they don’t follow systematic procedures for gathering requirements, managing projects, and developing software solutions. They end up deploying multiple tools, embedding logic into reports, and spawning multiple, inconsistent views of information. Most of all, they don’t recognize the data resources available to them, and they lack the knowledge and skills to translate data into robust solutions using new and emerging BI technologies and techniques, such as OLAP cubes, in-memory visualization, agile methods, dashboard, scorecards, and predictive analytics.
On the flip side, the corporate BI team gets mired down with a project backlog that it can’t seem to shake. Adopting an industrialized assembly line mindset, it hires specialists to handle every phase of the information factory to improve efficiency (e.g. requirements, ETL, cube building, semantic modeling, etc.) yet it can’t accelerate development easily. Its processes have become too rigid and sequential. When divisions get restless waiting for the BI team to deliver, CFOs and CIOs begin to question their investments and put its budget on the chopping block.
Evolving into Solutions Providers
Rethink Everything. To overcome these obstacles, a corporate BI team needs to rethink its mission and the way it’s organized. It needs to actively engage with the business and take some direct responsibility for delivering business solutions. In some cases, it may serve as an advisor to a business unit which has some BI expertise while in others it may build the entire solution from scratch where no BI expertise exists. By transforming itself from a back-office data provider to a front-office solutions developer, a corporate BI team will add value to the organization and have more fun in the process.
It will also figure out new ways to organize itself to serve the business efficiently. To provide solutions assistance without adding budget, it will break down intra-organizational walls and cross-train specialists to serve on cross-functional project teams that deliver an entire solution from A to Z. Such cross-fertilization will invigorate many developers who will seize the chance to expand their skill sets (although some will quit when forced out of their comfort zones). Most importantly, they will become more productive and before long eliminate the project backlog.
A High Performance BI Team
For example, Blue Cross/Blue Shield of Tennessee has evolved into a BI solutions provider over the course of many years. BI is now housed in an Information Management (IM) organization that reports to the CIO and is separate from the IT organization. The IM group consists of three subgroups: 1) the Data Management group 2) the Information Delivery group and 3) the IM Architecture group.
- The Data Management group is comprised of 1) a data integration team that handles ETL work and data warehouse administration and 2) a database administration team that designs, tunes, and manages IM databases.
- The Information Delivery group consists of 1) a BI and Performance Management team which purchases, installs, and manages BI and PM tools and solutions and provides training and two customer-facing solutions delivery teams that work with business units to build applications. The first is the IM Health Informatics team that builds clinical analytic applications using reporting, OLAP, and predictive analytics capabilities, and the second is the IM Business Informatics team which builds analytic applications for other internal departments (i.e. finance, sales, marketing).
- The IM Architecture group builds and maintains the IM architecture, which consists of the enterprise data warehouse, data marts, and data governance programs, as well as closed loop processing and the integration of structured and unstructured data.
Collaborative Project Teams. Frank Brooks, director of data management and information delivery at BCBS of Tennessee, says that the IM group dynamically allocates resources from each IM team to support business-driven projects. Individuals from the Informatics teams serve as project managers, interfacing directly with the customers. (While Informatics members report to the IM group, many spend most of their in the departments they serve.) One or more members from each of the other IM teams (data integration, database administration, and BI/PM) is assigned to the project team and they collaboratively work to build a comprehensive solution for the customer.
In short, the BI team of BCBS of Tennessee has organized itself as a BI solutions provider, consolidating all the functions needed to deliver comprehensive solutions in one group, reporting to one individual who can ensure the various teams collaborate efficiently and effectively to meet and exceed customer requirements. BCBS of Tennessee has won many awards for its BI solutions and will be speaking at this summer’s TDWI BI Executive Summit in San Diego (August 16-18.)
The message is clear: if you want to deliver value to your organization and assure yourself a long-term, fulfilling career at your company, then don’t be satisfied with being just a data provider. Make sure you evolve into a solutions provider that is viewed as a strategic partner to the business.
Posted by Wayne Eckerson0 comments