More than 70 business intelligence directors and sponsors gathered in San Diego this week for the TDWI’s semi-annual BI Executive Summit. The executives were enlightened by a mix of case studies (NetApp, Dell, Arizona State University, RBC Wealth Management, and ShareThis) and educational sessions on key areas of interest (BI in the Cloud, change management, cost estimating BI projects, Hadoop, visualization, BI mashups, social intelligence, pervasive BI, and the future of BI.)
The attendees also voted on technologies and programs that will be of key interest to them in the next three years. Topping the technology chart were predictive and in-database analytics, dashboards, visualization, the cloud, and operational BI. On the process side, key initiatives will be data quality and governance, business process management, and BI competency centers.
The event’s sponsors also chimed in during sessions and the future of BI panel. Teradata discussed active data warehousing, Information Builders showed how to integrate strategic, tactical, and operational BI, Birst discussed the benefits of cloud-based computing via its customer RBC Wealth, Sybase discussed in-database analytics via SQL-based plug-ins from Fuzzy Logix, and IBM discussed innovations in BI, such as search, collaboration, and mashups.
Most attendees valued the networking and collaboration that the event offers during lunch and breaks. In addition, hands-on workshops put the attendees in the drivers seat. During the Dell case study, attendees were given a real-life scenario of Dell’s data warehousing environment circa 2007 and then in groups had to decide how they would have approached the issues that Dell faced. After considerable discussion and debate, representatives from Dell—who were actively taking notes during the discussion phase—told the audience how they approached the situation. The workshop on change management also asked the attendees to work in small groups to discuss the implications of the FEE (fear, entitlement, earning.)
Quotable Quotes from the event:
- “You typically only need 12 metrics to run a company.” Tony Politano, consultant and author of Chief Performance Officer
- “Our dashboards, which are all built on the same platform and enterprise model, provide enterprise, functional, and role based views of information.” Dongyan Wang, NetApp
- “We designed the dashboard so that any user could get any information they want at any level of detail in three clicks.” Dongyan Wang, NetApp
- “A dashboard should provide more than composite views of information; they should allow users to create a personalized mashup via Web services and widgets so the environment caters to their needs.” Laura Edell Gibbons
- “Add a top 10 list to your portal to enhance usage and pay attention to principles of visual design.” John Rome, Arizona State University
- “We inventoried our spreadmarts and found we had about 40,000 around the world and that didn’t even count spreadsheets.” Rob Schmidt, Dell
- “It’s important to pick data governance decision makers at the right level; we had Michael Dell’s direct reports.” Mike Lampa, Dell
- “The initial response of the business units to the decision to shift analysts who spent most of their time creating reports into IT was ‘Go to hell!’ But quickly, the saw that the move would free up budget dollars and headcount for them and they bought into the decision.” Mike Lampa, Dell
- “One lesson learned [during the Dell DW renovation] was losing sight of the importance of delivering value while establishing and enforcing enterprise standards.” James Franklin, Dell
- “Our BI architectures are rooted in outdated assumptions of resource scarcity.” Mark Madsen, Third Nature
- “Because of advances in processing and storage power, we could now ship the data warehouse that I built in 1993 for $1.5 million on a laptop to every individual in the company.” Mark Madsen, Third Nature
Posted by Wayne Eckerson0 comments
Yesterday, I had doubts about the value of driving from Boston to New York (eight hours roundtrip) to attend a short IBM briefing on Smart Analytics, but thankfully IBM didn’t disappoint, at least in the end.
SPSS Acquisition
The Non Announcement. The briefing consisted of two announcements and one non-announcement.
The non-announcement was that IBM acquired leading analytics vendor, SPSS, for $1.2 billion. Oddly, the acquisition wasn’t the focus of the Smart Analytics briefing I was attending, as I assumed once I saw the press release. In fact, as I learned later, it was a coincidence that the SPSS announcement occurred on the same day as the Smart Analytics briefing. This was reinforced by the fact that the IBM software executives (Steve Mills and Ambuj Goyal) didn’t say much about the acquisition other than it would “embed the technology across our platform.” What I find strange about that statement is that IBM had a great data mining product called Intelligent Miner which it discontinued as a standalone product several years ago and embedded its functionality inside DB2 and other applications. So, they basically bought what they already had or still have. Odd.
Anyway, after five minutes discussing its head-turning non-announcement, IBM then turned to the real focus of the briefing, which was to announce the Smart Analytics System and the Smart Analytics Optimizer. The first is a new twist on an old yarn, but the second is potentially groundbreaking.
IBM Smart Analytics System
InfoSphere Redux? To understand the Smart Analytics System, you have to know what IBM means by analytics. To IBM, analytics is Cognos 8—which in reality is query, reporting, dashboarding, and some OLAP. It’s not data mining or predictive analytics (things that SPSS does), although I suspect that will evolve in short order.
What I gleaned in one-on-one meetings after the briefing (IBM briefings are traditionally long on concepts and short on details) is that the IBM Smart Analytics System is IBM Infosphere Balanced Warehouse done right, with Cognos 8 embedded as an optional add on. At least this is the first instantiation of the Smart Analytics System. Eventually, IBM will embed other components from its vast array of ever expanding software products into the Smart Analytics System, including presumably SPSS, as well as ETL, data quality, cubing, and archiving. It will also expand the platforms supported (beyond the IBM Power platform currently) and the number of high-end, out-of-box configurations (currently, based on data volumes: 4TB, 12TB, 25TB, 50TB, 100TB, and 200TB.) So from a systems perspective, it’s not all that new.
Radical Reworking. But from a customer and IBM perspective, Smart Analytics System represents a fundamental overhaul of how IBM goes to market and meets customer needs. For the first time, customers can purchase a vertically integrated IBM system—from hardware and software to tools and applications to consulting and support services—with a single SKU and have the system configured, tested, and shipped in as little as two weeks with a single point of contact for support. IBM will then periodically perform health checks to ensure performance still meets customer requirements.
Back to the Future. If you have some history in the high tech market, you might remember that this is similar to the way that IBM operated prior to the early 1990s. If you were an IBM customer then, you bought vertically integrated systems to run your core applications and were a “big Blue” shop through and through. But with the advent of Unix and open computing, IBM began losing market share, and to ward off financial ruin, it brought in CEO Lou Gerstner who decided to blow apart IBM’s business and systems models. To overcome the stigma of selling closed, proprietary systems in an open world, Gerstner created autonomous divisions for hardware, software, tools, and services and gave them permission—in fact exhorted them—to partner with all players, including fierce competitors of the other divisions. In short order, IBM consultants began recommending non-IBM hardware and software, DB2 began running on non-IBM hardware, and IBM hardware began running non-IBM chips, operating systems, and databases. And it worked financially, saving the company, but it came at a price.
Making IBM Easy to Do Business With. The price is that IBM has become increasingly difficult to do business with. In fact, from a customer perspective, IBM looks and feels like multiple companies rather than one. This increases the costs, complexity, time to value when deploying IBM solutions. To keep legendary IBM executive Tom Watson from rolling in his grave, IBM now is rediscovering its roots and providing vertically integrated systems and a single face to the customer. To do this, IBM is more closely aligning its product divisions, which is perhaps the biggest upshot of the announcement.
IBM’s attempts to reduce costs, complexity, and time to value through the Smart Analytics System resonated with a panel of IBM customers at the briefing. Ironically, none had implemented a Smart Analytics system or had even heard of it until the night before, but all said that it would have saved them a lot of time, money, and headaches. So IBM has rediscovered what worked prior to the 1990s (vertical integration), but without losing what has worked since (horizontal integration.) IBM will need this new hybrid model to compete in an increasingly competitive BI marketplace where established vendors and upstarts are shifting to selling vertically integrated solutions, some using open source and the cloud to radically alter the rules of the game.
Smart Analytics Optimizer
Purpose-Built Analytical Database? Perhaps the more interesting announcement was the Smart Analytics Optimizer, whose details I teased out in a one-on-one meeting with Arvind Krishna, vice president of enterprise information management products. I wanted to ask Arvind when IBM is going to get analytics religion and build or buy a purpose-built database optimized for query processing. But before I could, he rattled off a long list of limitations of traditional transaction databases when performing queries (e.g. ACID properties, logging, indexes, etc.) and the tradeoffs of new query processing architectures (e.g. in memory, columnar, cubes, parallelization, etc.) . He finished by saying, “What if we do it all? Only better?”
Well, that got my attention.
In Memory Sandbox. It turns out that Smart Analytics Optimizer, which will ship in Q4 for IBM Z mainframes, provides a super-fast query database inside a transaction processing system. The Optimizer lets you store a copy of highly trafficked query data in up to 1TB of main memory and uses compression, vector processing, and a proprietary IBM data format ("better than columnar" Arvind says) to accelerate query performance by a factor of 10 or more. From there, IBM’s cost-based optimizer knows whether to direct queries to the in-memory database or the transaction database to get the best performance. Today, IBM consultants will help companies figure out which data to allocate to memory but in the future this task will be automated.
Best of Both Worlds. If I heard Krishna right, then the Smart Analytics Optimizer gives customers the reliability and availability of a transaction system and the performance of a purpose-built query processing system—but all in one system. In other words, customers don’t need to offload queries from a transaction system or offload analytics from a data warehouse. They might only need one system for transactions and analytics! This saves plenty of dollars compared to offloading queries to a stand alone analytical system. Eventually, the Smart Analytics Optimizer will be ported to other IBM systems and support upwards of 50TB of main memory, Krishna says.
Last But Not Least. If what Krishna says is true, then IBM has figured out how to make an end-run around the spate of new analytic database vendors in the market today and finally has a response to Oracle’s Database Machine and Exadata Storage Server and Microsoft’s Project Gemini, both of which turbocharge their flagship database management systems with purpose-built analytical add ons.
Posted by Wayne Eckerson0 comments
“The enterprise software market is breaking down,” proclaimed Mark Madsen at a meeting of TDWI’s Boston Chapter yesterday. “And this opens the door for open source software.”
Madsen said the business model for enterprise software vendors has switched from selling licenses to selling maintenance and support. He said maintenance fees now comprise 45% of revenues and a lionshare of profitability. This is largely because the software market has matured and consolidated, leaving customers hostage to a few big companies, Madsen said.
Eager to echo this theme, Brian Gentile, CEO of open source BI vendor Jaspersoft, said the software market is ripe for disruption. “Oracle recently reported it delivered 51% margins for the quarter, yet I hear from countless senior executives that they can no longer afford their current software maintenance contracts and are looking for options.” Gentile said these executives often report that maintenance costs consume up to 80% of their IT budget.
(The TDWI Boston Chapter will make a copy of slides at its Web site shortly.)
As prices rise, IT executives are increasingly scrutinizing exactly what they are getting for their money. Many lament the “feature bloat” of enterprise software. “When I was a BI director,” said Madsen, “we used less than 40% of the features in our BI tools.” “And while open source products may not have all the bells and whistles, they pass the ‘good enough’ test,” said Madsen.
Will Interest Translate into Sales?
Not surprisingly, interest in open source BI tools has skyrocketed as the economy plummeted. Many BI teams are looking for ways to reduce costs while still delivering value. Speaking from the audience, Doug Newton, a data warehousing manager at the Mathworks and a coordinator for TDWI’s Boston Chapter, said that open source software makes it really easy to “kick the tires” before committing to a purchase. He told the audience that he downloaded open source software from Infobright, among others, and liked what he saw, although his company has yet to start using open source tools.
Evidently, Newton is not alone. Gentile says Jaspersoft averages 250,000 downloads a month for its free community edition and has had 9 million downloads since its inception six years ago. “Most aren’t paying us anything… yet,” says Gentile. Infobright, an open source columnar database vendor, which also presented at the event, says it has had 10,000 downloads since it's inception and expects that number to jump as more people hear about the company.
To date, there has been a lot more tire kicking than usage, although many experts (including myself) predict that that will gradually change. The TDWI chapter surveyed its users and found that 55% had yet to deploy open source software. Among those that have implemented open source BI tools, 35% have deployed MySQL, 20% Pentaho, 10% Jaspersoft, 6% BIRT, and 6% Talend. Their primary reason for deploying open source BI tools is cost (75%), followed by quick to deploy (30%) and unhappiness with their incumbent BI tools (14%).
Free Isn’t For Everyone
But not all lookers are hooked. Madsen said open source isn’t for everyone. “Just because it’s free, doesn’t mean it’s right for you.” Madsen said you still need to evaluate open source tools like any other BI tool. He said “missing features,” “lack of scalability,” “need for internal expertise” and “switching costs” are the biggest reasons why companies pass on open source tools.
Most open source BI vendors are small startups, which raises the question of vendor viability. Gentile deflected this issue by pointing to the rich community of developers that surrounds each open source product. “If Jaspersoft were to disappear tomorrow, our code would live on for a very long time because there is a strong developer community that has contributed to the code and is vested in its future.”
Leading Adopters
Small companies are leading the charge into open source BI, according to Madsen, but medium and large companies are not far behind. Small companies are deploying open source BI tools on an enterprise basis while large companies are using it in departmental pockets, usually to augment existing BI tools or fill a vacuum where no BI tools exist, Madsen says.
Kevin Haas, a partner at OpenBI, a BI consultancy that helps companies build applications with open source BI tools, says most of his clients use the free community edition of open source BI products. However, the clients with the biggest applications—those deployed on an enterprise scale—implement the commercial or premium version of the tools, which offer additional functionality for enterprise deployments as well as support, scheduled release cycles, and indemnity.
While adoption by end-user organizations is growing slowly, uptake by independent software vendors (ISVs) has been sizable. Open source makes it easy for ISVs to enrich their own applications by embedding open source reporting or analytical tools into their products. In fact, Gentile said hundreds of thousands of people are using Jaspersoft without knowing it because it’s embedded in other applications. The nascent market for software-as-a-service applications has been a particularly robust market for open source BI vendors.
Inexorable Rise
If the mantra of business today is “faster, better, cheaper” then it’s inevitable that companies need to explore alternatives to traditional enterprise software. Currently, open source BI tools offer significant cost savings over established BI vendors. As open source BI tools mature and continue to undercut established players on price and flexibility, we will see an inexorable rise in the adoption of open source BI tools.
Posted by Wayne Eckerson0 comments
Let’s face it. Most of our BI programs could use a little boost. Despite our best intentions, our BI programs aren’t getting the traction we (or our sponsors) anticipated. Performance is too slow or the data is suspect or we didn’t deliver exactly what users wanted. Or maybe, after years of disappointment, bungled communications, or cost overruns, the business simply doesn’t trust IT to do anything right.
If this describes your situation, it’s time for a quick win. You’re stuck in a perpetual negatively reinforcing loop and you need something dramatic—but quick and cheap—to get you and your team out of its rut. You need to do something that will bring a smile to their face and make them see you as an ally who can solve their problems. If your quick win succeeds, the business will shower you with money to fund more projects, including extensions to your data warehouse.
Of course, there is a catch. A quick win usually requires you to work outside of established platforms, processes, and procedures. While those things ensure that IT delivers stable, scalable solutions, they often impede quick action. A quick win often requires you to build something outside the existing architecture (especially if your existing data warehouse isn’t properly designed or supported.) As such, you need enough seniority or clout to bend the rules and make things happen.
This week I talked with a veteran BI director at a company who inherited a stalled data warehouse and a culture of distrust between business and IT. To gain credibility for the BI program and bridge the business-IT gulf, he sought a quick win. To scope his project, he met informally with business managers and executives to discuss their frustrations and needs. (As a former accountant he could “talk the talk” of business which helped immensely.) He learned that the company suffered from the “dueling spreadsheet” syndrome where executives from different departments couldn’t agree on basic sales numbers because they defined “product” differently. He got approval for a project that would track three “product” metrics through product development and launch. (Phase two will track product performance after launch.)
The project took six months from start to finish for approximately $75,000 (although this company doesn’t track costs for internally used resources. The solution enabled the company’s top executives for the first time to monitor a process that cut across departmental boundaries using standardized metrics. Needless to say, the solution was a big success and garnered the BI team much needed credibility. The caveat here is that he did not build the application on top of the existing data warehousing platform which has stringent change control processes which would have delayed deployment and increased costs. But with this quick win under his belt, the manager is now securing support and funding to overhaul the data warehouse. Eventually, he will retrofit the quick win application to run within the data warehousing environment.
The moral of the story is that a quick win can help build goodwill with the business and galvanize support that is needed to turn around a sagging data warehousing initiative. But to achieve a quick win, you often have to break the rules and work outside of standard architectures, processes, and procedures. If you are willing to take a risk, the rewards can be significant.
Posted by Wayne Eckerson0 comments
The BI/DW market has flowed quite independently for more than a decade, but increasingly it’s converging with other software streams, including ERP, MDM, search, and content management. This makes for an exciting, if not confusing, marketplace.
For example, what does BPM stand for? Business performance management or business process management? Well, technically it stands for both, but the identical acronyms have caused heartburn for those who have tried to evangelize, analyze, buy, or sell software in these two rapidly converging domains.
Helge Hess, SVP of Product and Solution Marketing at Germany-based IDS Scheer, shines a clear light on the space. He uses the term “process intelligence” to describe software that visualizes and analyzes how well business processes execute. I like the term. It reflects the growing convergence of process management and business intelligence yet creates a distinct identity for this emerging class of software.
For example, IDS Scheer’s ARIS Process Performance Manager, which shipped six years ago and is used by 300 customers, helps managers evaluate the performance of core processes and understand the root causes of highlighted problems and inefficiencies, according to Hess. (See figure 1.)
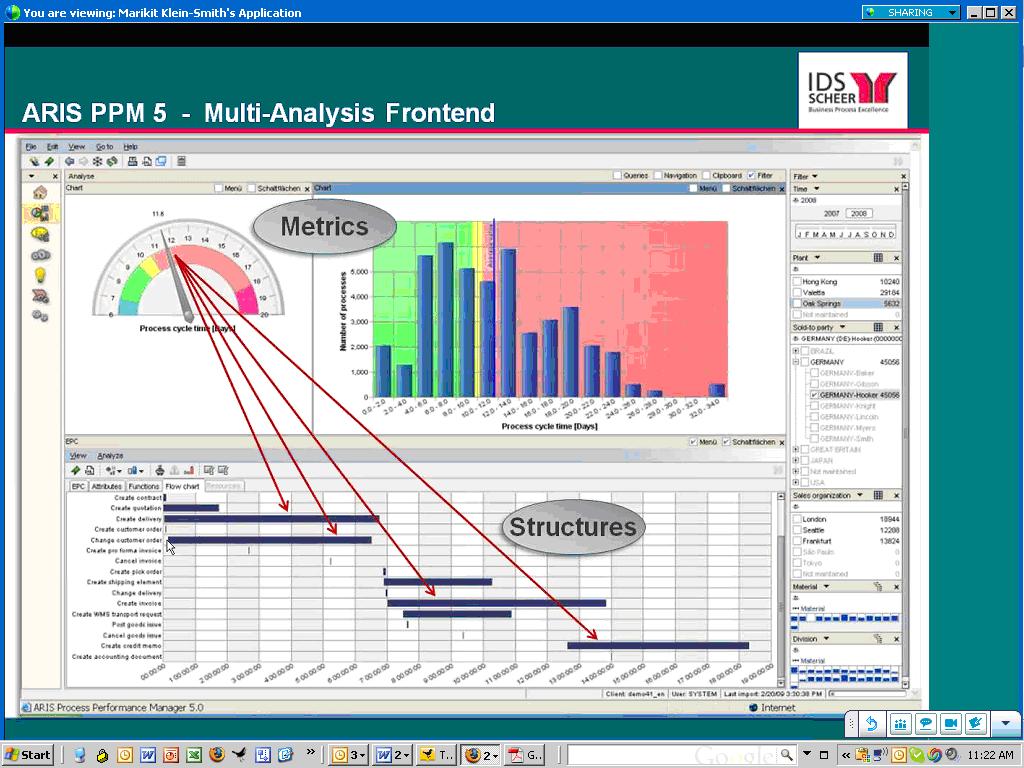
Figure 1. IDS Scheer’s ARIS Process Performance Manager lets users drill down from a performance metric in a dashboard to underlying process steps that caused the alert.
IDS Scheer partners with the big process management players (Oracle, SAP, Microsoft, and Tibco). For example, SAP resells ARIS PPM and Tibco OEMs it. While some partners offer process intelligence tools, Hess says its biggest competitors in this space are BI vendors. This is not because they offer process intelligence tools but because the IT department doesn’t want to purchase another “analytical” product unless it can eliminate other BI tools it already has through a standardization or consolidation program.
Selling into that kind of environment is challenging. Plus, mapping out business processes sounds like a nightmare and a potentially big inhibitor to doing deals. So I asked Hess to explain where his company has been most successful in selling ARIS PPM. He said the biggest market for the product is SAP customers who want to analyze “order-to-cash” and “procure-to-pay” processes within SAP’s sales and administration and procurement modules respectively. IDS Scheer offers a package for these two processes that come with predefined extraction routines for SAP content and analytical templates for displaying key process metrics. The packages reduce the complexity and time needed to map processes and deploy the tool.
“It takes five days to install and configure the packages” compared to 15 to 20 days for a custom implementation, says Hess. IDS Scheer also offers packages for human resources (“hire to retire” and recruitment), IT (incident management), accounting (billing), insurance (claims management) and banking (loans.) However, Hess was quick to point out that process mapping isn’t a time consuming nightmare. Evidently, ARIS PPM can automatically generate process workflows using sophisticated algorithms, which takes the pain out of mapping actual processes. I’ll have to see this to believe it!
Finally, Hess said that last year IDS Scheer augmented its nascent process intelligence portfolio by shipping a a product called ARIS Process Event Manager (PEM). Whereas ARIS PPM helps customers analyze and optimize processes, PEM monitors events so front-line workers can take action and close the loop. I’ve written about products like this in my research on operational BI. (Click here for a recent report.) Until recently, most companies needing such capabilities for fraud detection, stock market trading, or online recommendation engines have built it themselves. However, the off-the-shelf products from IDS Scheer, Altosoft, SeeWhy, and Coral8 (now Aleri) enable companies to save money and time when creating event-driven analytical applications.
Posted by Wayne Eckerson0 comments
Cloud computing offers a lot of promise. By virtualizing hardware and software infrastructure and paying a third party to deliver services as you go on a subscription or usage basis, companies can save a lot of money and time, and speed the deployment of business solutions.
Initially, cloud-based solutions were designed for small- to mid-size companies that didn’t have available IT resources or capital to spend on creating and managing a software and hardware infrastructure. Today, many large companies are investigating the cloud as a way to add new business solutions quickly and augment existing data center capacity. But cloud computing isn’t for everyone, especially in the BI space.
Types of Cloud Offerings
To understand what makes sense to deploy in the cloud, you first have to fathom what the cloud does. In essence, the cloud abstracts underlying services and is a common metaphor for the Internet, which routes data dynamically across a global network based on capacity and other factors. Today’s cloud delivers three levels of services that together comprise a solutions stack: applications, platforms, and infrastructure services. (See figure 1.)
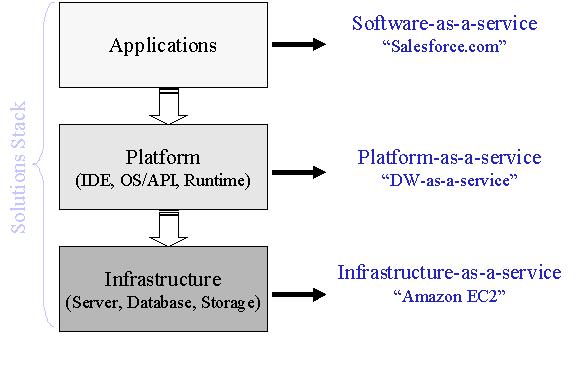
SaaS. Application services are typically called software-as-a-service (SaaS). Salesforce.com, which was founded in 1999 to deliver sales solutions online to small- and mid-sized companies, popularized the notion of SaaS. Salesforce.com now boasts 1.1 million subscribers and has spawned lots of imitators. With SaaS, employees use a browser to access an online application, which is housed and managed by the SaaS provider. There is no hardware to configure or software to install and no licenses to purchase. You simply pay a monthly subscription fee for each user, and you’re up and running.
IaaS and PaaS. In the past several years, the cloud industry has grown, spawning two more services: platform as a service (PaaS) and infrastructure as a service (IaaS). Amazon popularized the latter with the advent of its EC2 cloud computing offering, which lets IT administrators dynamically provision servers in Amazon’s data center and pay according to usage. Many IT administrators now use IaaS as a convenient, low-cost way to maintain development, test, or prototyping environments or to support analytic sandboxes that have a short lifespan. PaaS is the newest addition to the cloud family, allowing developers to build and deploy custom cloud-based applications and solutions. Many PaaS customers are ISVs that want to create cloud-based offerings or enhance them with complementary applications, such as reporting or analysis.
BI in the Cloud
From a BI perspective, all three incarnations of the cloud offer interesting possibilities, but come with constraints. For instance, SaaS offerings are essentially packaged analytic applications. Like their on premises brethren, SaaS offerings need to be highly tailored to an application domain so the solution fits the customer requirements like a glove and doesn’t require endless and unprofitable rounds of customization. And it doesn’t do much good if the SaaS vendor only supports one application out of several because the customer then will end up with a mix of on premise and hosted solutions that are difficult to integrate. So, unless the SaaS vendor supports a broad range of integrated functional applications, it’s hard to justify purchasing any SaaS application.
Data Transfers. Another constraint is that all three types of BI cloud offerings need to transfer data from an internal data center to the cloud. Most BI solutions query a data warehouse or data mart that is continuously loaded from operational systems residing in the company’s data center. Currently, moving large volumes of data on a regular basis to the cloud over the public internet injects latency and complexity into the load process and can become expensive since cloud providers charge fees for data transfers and data storage. In addition, users that query cloud-based data marts using BI tools that run on inhouse servers, then their queries and result sets also travel across the internet, adding more latency and cost.
Given this constraint, BI cloud-based solutions are ideal in the following situations:
- Small companies that don’t have a lot of data.
- Applications that don’t require lots of data, such as development and test environments or small data marts that can be updated quickly.
- Applications in which all source data already exists in the cloud (e.g. Salesforce.com or a start-up company that runs its entire business in the cloud.
- Ad hoc analyses that require one-time import of data from one or more sources. The cloud is proving an ideal way to support data-hungry analysts.
- Report sharing
Data security. Data security is another constraint, but one that is largely illusory. Companies are reluctant to move data outside of the corporate firewall for fear that it might get lost or stolen. Highly publicized data thefts in recent years certainly feed this sentiment. But the fear is largely irrational. Most companies already outsource sensitive data to third party processors, including payroll (e.g. ADP) and customer and sales data (e.g. Salesforce). And when IT administrators examine the data center and application level security supported by cloud vendors, most will say that the data is probably more secure in these data centers than their own! Most new technologies encounter the same criticisms: for example, many thought e-commerce would lead to widespread fraud when it first became available in the late 1990s.
Due Diligence. Nonetheless, companies looking to “outsource” applications, platforms, or infrastructure to the cloud should investigate the cloud providers operations to ensure that they can meet your system level agreements for security, availability, reliability, scalability, and performance. For instance, what is the providers failover and backup procedures? Do they have a disaster recovery plan? Do they comply with SAS 70 data center security protection guidelines?
In addition, you should carefully analyze pricing policies and total cost of ownership. Does the SaaS provider charge set up or cancellation fees? At what point in the future will the total cost of the SaaS solution cost more than if you had purchased a premises-based license?
Finally, you should analyze the vendor’s viability. SaaS vendors take on greater risk than traditional software vendors because their financial model accumulates revenues on a subscription basis rather than upfront. And since SaaS vendors must invest in more hardware and customer support resources, they are prone to suffer from lack of capital. As testimony to the challenge of launching SaaS-based products, LucidEra, one of the first BI for SaaS offerings, closed its doors in June because it couldn’t secure another round of funding. (See my blog: "The Economy Takes Its Toll.")
Conclusion
BI for SaaS offers a lot of promise to reduce costs and speed deployment but only for companies whose requirements are suitable to cloud-based computing. Today, these are companies that have limited or no available IT resources, little capital to spend on building compute-based or software capabilities inhouse, and whose BI applications don’t require significant, continuous transfers of data from source systems to the cloud.
Posted by Wayne Eckerson0 comments
This past week, I learned that two BI startups—Dataupia and LucidEra—lost their funding and will soon fade from the limelight. In normal times, investors would have considered both companies good bets to achieve an IPO or major acquisition. Both had gained traction in the marketplace: Dataupia, a data warehouse appliance, had five customers and many prospects in a hot market, while LucidEra, a first mover in the BI software-as-a-service market, had a strong pipeline of customers.
These two companies brought new innovations the market, and it’s sad to see them go. I wonder how many other startups are teetering on the edge of extinction. A recent Gartner Group report claimed that big BI vendors were expanding at the expense of mid-market ones (and presumably small ones as well), suggesting that customers have been engaged in “stack-centric buying,” according to Gartner analyst Dan Sommer, as quoted in InformationWeek.
Given the current cost-cutting environment, it makes sense that customers would reduce BI expenditures by consolidating on a single platform (although this requires a significant capital outlay.) And many customers probably fear purchasing BI software from smaller vendors who may not outlast the downturn.
I’ve been asked several times in public forums about the state of innovation in the BI industry. Usually, the question stems from recent market consolidation and fears that big ERP/CRM vendors (i.e. Oracle, SAP, et. al.) will stifle BI innovation as they focus on integrating product lines and people and driving sales of newly minted mainstream software (i.e. BI tools and platforms.) Although ERP vendors may bureaucratize BI and lose talented people in the process, it appears that they may be our best chance of keeping innovation alive, until the economy makes a substantial recovery.
Posted by Wayne Eckerson0 comments
I love software that I can download from the internet, implement without reading a manual or attending a training class, use in production free of charge for 30 days, and then purchase with a credit card at bargain basement prices.
I did just that recently with Citrix’s GoToWebinar software. I even conducted a very successful live Webinar for 300 people before the trial period ended. For a fraction of the price and with almost all the same bells and whistles, GoToWebinar puts competing products to shame, such as On24, WebEx, and LiveMeeting.
You might assume, as I did, that this bright new era of Web-based software distribution is suitable for low-end solutions and consumer-oriented software, but certainly would never work for enterprise-caliber systems, such as those we have come know and love (or hate?) in the data warehousing (DW) and business intelligence (BI) market. But you would be wrong.
15-minute Rule
I had a nice chat today with Miriam Tuerk, CEO, and Susan Davis, VP of marketing, at Infobright, an open source provider of a high-end analytical platform by the same name that targets the MySQL market. The company, based in Toronto, was founded in 2005, began shipping product in 2007, and now has 50 paying customers, mostly mid-market companies in the Internet, telecommunications, and financial services markets that want to analyze large volumes of data and expect fast query performance at low cost without much setup or maintenance.
“We have a 15 minute rule,” says Tuerk. “A knowledgeable MySQL database administrator should be able to download Infobright and implement it within 15 minutes.” Tuerk estimates that 10,000 individuals have downloaded the free, community version of the software. Paying customers, which include Xerox, Telus, and the Royal Bank of Canada, pay annual fees of $9,950 and $15,950 per terabyte for additional features, such as faster loading, support for slowly changing dimensions, the ability to insert, update, and delete data from the column-store database, and guaranteed support levels. That’s a bargain as far as I’m concerned.
Although Infobright gives up potential revenue by using this pricing and distribution model, it saves a lot by not having to conduct expensive proofs of concept in competitive deals at enterprise accounts.
Secret Sauce
Infobright is not only easy to do business with, it has some interesting technology that sets it apart from the pack of 20+ analytical platform providers crowding the market these days. It doesn’t require database designers to create indexes, partitions, and aggregates and minimizes schema design and ETL work. This saves time and money and requires fewer experts to get the system up and running.
Data Packs and Compression. It stores columnar data in 64k data packs, each of which can be compressed with different compression algorithms that are best suited to the data within. So, Infobright compresses data to one-tenth to one-fortieth of the raw data size. This lowers cost by reducing the amount of hardware and storage needed to analyze large data volumes, and it accelerates data loading speeds, which Tuerk says are the fastest in the industry per server at 280GB/hour.
Metadata. While most database management systems store two or three times the amount of raw data due to overhead (e.g. indexes, aggregates, partitions), the only extra data that Infobright adds is what it calls a Knowledge Grid, which is usually small enough to store in memory, according to Tuerk. The Knowledge Grid is metadata about the data packs—statistical data (min/max, average, counts, etc.), histograms of the data values in each data pack, and relationships among data packs. Many queries can be answered from the Knowledge Grid alone, accelerating response times to the speed of memory.
Query Optimization. Using statistics and pointers, the Knowledge Grid enables the Infobright optimizer to quickly identify the handful of data packets that need to be decompressed to resolve a query. It also works heuristically, using intermediate results to refine query plans. Rather than spreading queries and I/O across multiple nodes like MPP databases, Infobright’s architectural approach is premised on doing as little disk I/O as possible.
Scalability. From a hardware perspective, Infobright is a single-server system that currently scales to 50TB although Tuerk says that is not a physical limitation and systems can handle more data if necessary. It provides full support for SQL 92 and some SQL 99 extensions but it doesn’t yet participate in TPC benchmarks, so it’s hard to validate scalability claims. Davis says they’ve been reluctant to participate because some benchmarks require full table scans, which is what their architecture tries to avoid.
From a query perspective, each processor core running on a Windows, Linux, or Solaris server can handle a single concurrent query at peak performance. So a 32-core system can handle 32 concurrent queries at peak performance, which is a significant limitation for customers at the high-end of their target market. As a consequence, Infobright has been working on a multi-server option—which it will ship later this year—that will let customers add servers and/or storage to scale out the amount of data or concurrent queries the system can support. This is not an MPP system, just a multi-server system using a shared disk architecture.
Conclusion. Overall, if you want a quick and easy analytic platform that is also powerful enough to meet the analytical needs of 95% of organizations, you should consider Infobright. They do it right!!
Posted by Wayne Eckerson0 comments