TDWI just released my newest Checklist Report, Seven Considerations for Navigating Big Data Cloud Services. The report examines what enterprises should think about when evaluating the use of public cloud services to manage their big data. The cloud can play an important role in the big data world since horizontally expandable and optimized infrastructure can support the practical implementation of big data. In fact, there are a number of characteristics that make the cloud a fit for the big data ecosystem. Four of these include:
- Scalability. Scalability with regard to hardware refers to the ability to go from small to large amounts of processing power with the same architecture. The cloud can scale to large data volumes. Distributed computing, an integral part of the cloud model, works on a “divide and conquer” plan. So if you have huge volumes of data, they can be partitioned across cloud servers.
- Elasticity. Elasticity refers to the ability to expand or shrink computing resource demand in real time, based on need. This means that you have the potential to access as much of a service when you need it. This can be helpful for big data projects where you might need to expand the amount of computing resources you need to deal with the volume and velocity of the data.
- Resource pooling. Cloud architectures enable the efficient creation of groups of shared resources that make the cloud economically viable.
- Self-service. This refers to the ability of a user to run a set of cloud resources via a portal or browser interface. This is different than requesting it from your IT department.
For instance, you might want to use a public cloud to run your real-time predictive model against high volumes of data because you don’t want to use your own physical infrastructure to do so. Additionally, some companies are using the public cloud to explore big data, and then move certain information to the data warehouse. In effect, the cloud extends the data warehouse. There are numerous use cases emerging for big data in the cloud.
TDWI is starting to see an uptick in interest in the public cloud for BI and analytics. For example, in our recent quick survey of users who attended our Las Vegas World Conference, only about 25% of respondents said they would never use the public cloud for BI or analytics. The rest were either currently using the cloud (about 18%) or were actively looking into it or considering it as a possibility. We saw a similar response in a quick survey we did at our Boston conference in the fall of 2013. This will be an active area of research for TDWI this year, so stay tuned!
For more on big data in the cloud, also refer to Big Data for Dummies.
Posted by Fern Halper, Ph.D.0 comments
It’s still early days, but users are starting to integrate big data with enterprise data, largely for business value via analytics.
By Philip Russom, TDWI Research Director for Data Management
A journalist from the IT press recently sent me an e-mail containing several very good questions about the state of big data relative to integrating it with other enterprise data. Please allow me to share the journalist’s questions and my answers:
How far along are enterprises in their big data integration efforts?
According to my survey data, approximately 38% of organizations don’t even have big data, in any definition, so they’ve no need to do anything. See Figure 1 in my 2013 TDWI report Managing Big Data. Likewise, 23% have no plans for managing big data with a dedicated solution. See Figure 5 in that same report.
Even so, some organizations have big data, and they are already managing it actively. Eleven percent have a solution in production today, with another 61% coming in the next three years. See Figure 6.
Does data integration now tend to be haphazard, or one-off projects, in many enterprises, or are architectural strategies emerging?
I see all the above, whether with big data or the usual enterprise data. Many organizations have consolidated most of their data integration efforts into a centralized competency center, along with a centrally controlled DI architecture, whereas a slight majority tend to staff and fund DI on a per-application or per-department basis, without an enterprise strategy or architecture. Personally, I’d like to see more of the former and less of the latter.
What are the best approaches for big data integration architecture?
Depends on many things, including what kind of big data you have (relational, other structures, human language text, XML docs, etc.) and what you’ll do with it (analytics, reporting, archiving, content management). Multiple big data types demand multiple data platforms for storing big data, whereas multiple applications consuming big data require multiple processing types to prepare big data for those applications. For these reasons, in most cases, managing big data and getting business use from it involves multiple data management platforms (from relational DBMSs to Hadoop to NoSQL databases to clouds) and multiple integration tools (from ETL to replication to federation and virtualization).
Furthermore, capturing and integrating big data can be challenging from a data integration viewpoint. For example, the streaming big data that comes from sensors, devices, vehicles, and other machines requires special event-processing technologies to capture, triage, and route time-sensitive data—all in a matter of milliseconds. As with all data, you must transform big data as you move it from a source to a target, and the transformations may be simple (moving a click record from a Web log to a sessionization database) or complex (deducing a fact from human language text and generating a relational record from it).
What "traditional" approaches are being updated with new capabilities and connectors?
The most common data platform being used for capturing, storing, and managing big data today are relational databases, whether based on MPP, SMP, appliance, or columnar architectures. See Figure 16 in the
Managing Big Data report. This makes sense, given that in a quarter of organizations big data is mostly or exclusively structured data. Even in organizations that have diverse big data types, structured and relational types are still the most common. See Figure 1.
IMHO, we’re fortunate that vendors’ relational database management systems (RDBMSs) (from the old brands to the new columnar and appliance-based ones) have evolved to scale up to tens and hundreds of terabytes of relational and otherwise structured data. Data integration tools have likewise evolved. Hence, scalability is NOT a primary barrier to managing big data.
If we consider how promising Hadoop technologies are for managing big data, it’s no surprise that vendors have already built interfaces, semantic layers, and tool functionality for accessing a broad range of big data managed in the Hadoop Distributed File System (HDFS). This includes tools for data integration, reporting, analysis, and visualization, plus some RDBMSs.
What are the enterprise "deliverables" coming from users’ efforts with big data (e.g., analytics, business intelligence)?
Analytics is the top priority and hence a common deliverable from big data initiatives. Some reports also benefit from big data. A few organizations are rethinking their archiving and content management infrastructures, based on big data and the potential use of Hadoop in these areas.
How is the role of data warehousing evolving to meet the emergence of Big Data?
Big data is a huge business opportunity, with few technical challenges or downsides. See figures 2 through 4 in the report
Managing Big Data. Conventional wisdom says that the opportunity for business value is best seized via analytics. So the collection, integration, and management of big data is not an academic exercise in a vacuum. It is foundational to enabling the analytics that give an organization new and broader insights via analytics. Any calculus for the business return on managing big data should be based largely on the benefits of new analytics applied to big data.
On April 1, 2014, TDWI will publish my next big report on
Evolving Data Warehouse Architectures in the Age of Big Data. At that time, anyone will be able to download the report for free from
www.tdwi.org.
How are the new platforms (such as Hadoop) getting along with traditional platforms such as data warehouses?
We say “data warehouse” as if it’s a single monolith. That’s convenient, but not very accurate. From the beginning, data warehouses have been environments of multiple platforms. It’s common that the core warehouse, data marts, operational data stores, and data staging areas are each on their own standalone platforms. The number of platforms increased early this century, as data warehouse appliances and columnar RDBMSs arrived. It’s now increasing again, as data warehouse environments now fold in new data platforms in the form of the Hadoop Distributed File System (HDFS) and NoSQL databases. The warehouse has always evolved to address new technology requirements and business opportunities; it’s now evolving again to assure that big data is managed appropriately for the new high-value analytic applications that many businesses need.
For an exhaustive discussion of this, see my 2013 TDWI report
Integrating Hadoop into Business Intelligence and Data Warehousing.
Posted by Philip Russom, Ph.D.0 comments
My new (and first!) TDWI Best Practices Report was published a few weeks ago. It is called Predictive Analytics for Business Advantage. In it, I use the results from an online survey together with some qualitative interviews to discuss the state of predictive analytics, where it is going, and some best practices to get there. You can find the report here. The Webinar on the topic can be found here.
There were many great questions during the Webinar and I’m sorry I didn’t get to answer them all. Interestingly, many of the questions were not about the technology; rather they were about how to convince the organization (and the senior executives) about the value in predictive analytics. This jives with what I saw in my research. For instance,”lack of understanding of predictive analytics” was cited as a key challenge for the discipline. Additionally, when we asked the question, “Where would you like to see improvements in your predictive analytics deployment?”, 70% of all respondents answered “education.” It’s not just about education regarding the technology. As one respondent said, “There is a lack of understanding of the business potential” for predictive analytics, as well.
Some of the questions from the audience during the Webinar echoed this sentiment. For instance, people asked, “How do I convince senior execs to utilize predictive analytics?” and “What’s the simple way to drive predictive analytics to senior executives?” and “How do we get key leaders to sponsor predictive analytics?”
There is really no silver bullet, but here are some ways to get started:
- Cite research: One way is to point to studies that have been done that quantify the value. For instance, in the Best Practices Report, 45% of the respondents who were currently using predictive analytics actually measured top- or bottom-line impact or both (see Figure 7 in the report). That’s pretty impressive. There are other studies out there as well. For instance, academic studies (i.e., Brynjolffson et al., 2011) point to the relationship between using data to make decisions and improved corporate performance. Industry studies by companies such as IBM suggest the same. Vendors also publish case studies, typically by industry, that highlight the value from certain technologies. These can all be useful fodder.
- Do a proof of concept: However, these can’t really stand alone. Many of the end users I spoke to regarding predictive analytics all pointed to doing some sort of proof of concept or proof of value project. These are generally small-scale projects with high business impact. The key is that there is a way to evaluate the impact of the project so you can show measurable results to your organization. As one respondent put it, “Limit what you do but make sure it has an impact.” Additionally, think through those metrics as you’re planning the proof of concept. Additionally, someone in the organization is also going to have to become the communicator/evangelist to get people in the organization excited rather than fearful of the technology. One person told me that he made appointments with executives to talk to them about predictive analytics and show them what it could do.
- BI foundation: Typically, organizations that are doing predictive analytics have some sort of solid BI infrastructure in place. They can build on that. For instance, one end user told me about how he built out trust and relationships by first establishing a solid BI foundation and making people comfortable with that and then introducing predictive analytics. Additionally, success breeds success. I’ve seen this countless times with various “new” technologies. Once one part of the organization sees something that works, they want it too. It grows from there.
- Grow it by acting on it: As one survey respondent put it, “Analytics is not a magic pill if the business process is not set up.” That means in order to grow and sustain an analytics effort, you need to be able to act on the analytics. Analytics in a vacuum doesn’t get you anywhere. So, another way to show value is to make it part of a business process. That means getting a number of people in the organization involved too.
The bottom line is that it is a rare company that can introduce predictive analytics, and behold! It succeeds quickly out of the gate. Are there examples? Sure. Is it the norm? Not really. Is predictive analytics still worth doing? Absolutely!
Do you have any suggestions about how to get executives and other members of your organization to value predictive analytics? Please let me know.
Posted by Fern Halper, Ph.D.0 comments
The Big Data Maturity Model and Assessment is set to launch on November 20th. Krish Krishnan and I have been working on this for a while, and we’re very excited about it.
As I mentioned in my previous blog post (see previous post, below), there are two parts to the Big Data Maturity Model and assessment tool. TDWI members will be getting an email about the assessment on November 20th. We urge you to take the assessment and see where you land relative to your peers regarding your big data efforts. Additionally, it’s important to note that we view this assessment as evolutionary. We know that many companies are in the early stages of their big data journey. Therefore, this assessment is meant to be evolutionary. You can come back and take it more than once. In addition, we will be adding best practices as we learn more about what companies are doing to succeed in their big data efforts.
In the course of our research for the model, Krish and I spoke to numerous companies embarking on big data. There were some patterns that emerged regarding how companies get started in their big data efforts. Here are a few of them:
- Large volumes of structured data are already being analyzed in the company. Some companies have amassed large volumes (i.e., terabytes) of structured data that they are storing in their data warehouse or in some sort of appliance, often on-premises. They feel that their BI infrastructure is pretty solid. Typically, the BI effort is departmental in scope. Some of these companies are already performing more advanced kinds of analysis; such as predictive analytics on the data. Often, they are doing this to understand their customers. The vision for big data is about augmenting the data they have with other forms of data (often text or geospatial data) to gain more insight.
- A specific need for big data. Some companies start a big data effort, almost from scratch, because of a specific business need. For instance, a wireless provider might be interested in monitoring the network and then predicting where failures will occur. An insurance company might be interested in telemetric information in order to determine pricing for certain kinds of drivers. A marketing department might be interested in analyzing social media data to determine brand reputation or as part of a marketing campaign. Typically these efforts are departmental in scope and are not part of a wider enterprise big data ecosystem.
- Building the business on big data. We spoke to many e-businesses that were building the business model on big data. While these companies might be somewhat advanced in terms of infrastructure to support big data often they were still working on the analytics related to the service and typically did not have any form of governance in place.
Remember to check your email!
Posted by Fern Halper, Ph.D.0 comments
We are getting ready to launch the TDWI Big Data Maturity Model and assessment tool in the next few weeks. We’re very excited about it, as it has taken a number of months and a lot of work to develop. There are two parts to the Big Data Maturity Model and assessment tool. The first is the actual TDWI Big Data Maturity Model Guide. This is a guide that walks you through the actual stages of maturity for big data initiatives and provides examples and characteristics of companies at different stages of maturity. In each of these stages, we look across various dimensions that are necessary for maturity. These include organizational issues, infrastructure, data management, analytics, and governance.
The second piece is the assessment tool. The tool allows respondents to answer a series of about 50 questions in the organization, infrastructure, data management, analytics, and governance dimensions. Once complete, the respondent receives a score in each dimension as well as some expectations and best practices for moving forward. A unique feature of the assessment is that respondents can actually look to see how their scores compare against their peers, by both industry and company size.
At the same time we’ve been building the Big Data Maturity Model, I’ve also been working on the predictive analytics Best Practices Report. Since no survey about analytics would be complete without some questions about big data, I did include a section about it in the survey. Interestingly, over 70% of the respondents actively using predictive analytics or planning to use it (242 respondents) from the survey claim to have some sort of big data push going on in their organization.
The group also reported a series a challenges (seen in the figure, below).
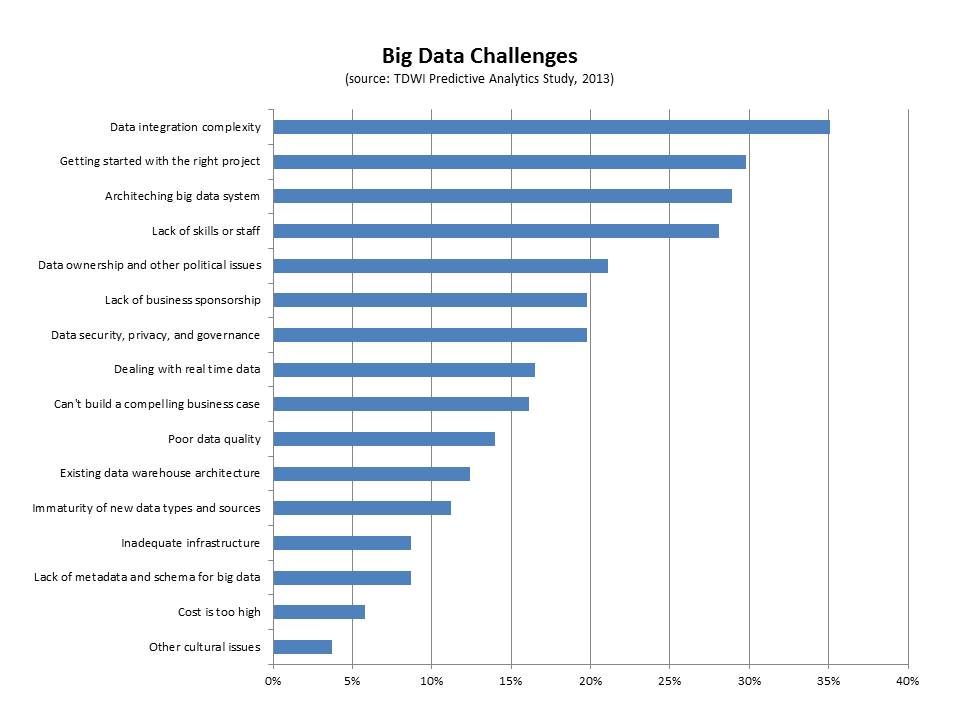
- Data integration. The top challenge cited by this group of respondents was big data integration (35%). Interestingly, if you look only at those respondents who are current users of predictive analytics and users of big data, 44% report this as the top challenge. Clearly, integrating disparate kinds of data from different sources is difficult. We saw this in our interviews for the big data maturity model. For instance, despite having some sort of data warehouse (especially in the case of the enterprise), a nascent organization in terms of big data maturity will often have also collected data as files with different formats, but without naming standards, and with storage structures that are minimally defined. This data is not integrated.
- Getting started with the right project. This is a key challenge that companies face when getting started with big data. Thirty percent of the respondents in this group cited it as a top challenge. We note this in the maturity model as well as a pre-adoption issue. Typically, there might be a team charged with exploring big data that is trying to determine the top business problems to solve. Identifying the right business problem is critical for success and business needs to get involved as quickly as possible.
- Architecting a big data system. Big data can mean disparate kinds of high-volume and high-frequency data. Architecting a system is important for success and it can be difficult. Twenty-nine percent of the respondents cited this as a challenge. The end goal for an architecture is frequently some sort of big data ecosystem that contains a unified information architecture which underpins analytics. Getting there can involve surgical precision in terms of rolling out infrastructure.
- Lack of skills or staff. Twenty-eight percent of respondents cited this as a top challenge. This is a key challenge, whether it is the skills for Hadoop or other big data infrastructure or the analytics skills required to make sense of big data. Different organizations approach the skills issue in different ways. Some hire externally or look for university hires. Others try to re-train from within. Still others look to cross-pollinate skills from one part of the organization to a team that utilizes new technologies. Some build centers of excellence that help with the training from within. Others form SWOT-type teams to address big data analytics.
Look out for e-mails and other materials over the next few weeks letting you know that the Big Data Maturity Model and assessment tool are live!
Posted by Fern Halper, Ph.D.0 comments
By Philip Russom
Research Director for Data Management, TDWI
To help you better understand new practices for managing big data and why you should care, I’d like to share with you the series of 30 tweets I recently issued on the topic. I think you’ll find the tweets interesting, because they provide an overview of big data management and its best practices in a form that’s compact, yet amazingly comprehensive.
Every tweet I wrote was a short sound bite or stat bite drawn from my recent TDWI report “Managing Big Data.” Many of the tweets focus on a statistic cited in the report, while other tweets are definitions stated in the report.
I left in the arcane acronyms, abbreviations, and incomplete sentences typical of tweets, because I think that all of you already know them or can figure them out. Even so, I deleted a few tiny URLs, hashtags, and repetitive phrases. I issued the tweets in groups, on related topics; so I’ve added some headings to this blog to show that organization. Otherwise, these are raw tweets.
Types of Multi-Structured Data Managed as Big Data
1. #TDWI SURVEY SEZ: 26% of users manage #BigData that’s ONLY structured, usually relational.
2. #TDWI SURVEY SEZ: 31% manage #BigData that’s eclectic mix of struc, unstruc, semi, etc.
3. #TDWI SURVEY SEZ: 38% don’t have #BigData by any definition. Hear more in #TDWI Webinar Oct.8 noonET http://bit.ly/BDMweb
4. Structured (relational) data from traditional apps is most common form of #BigData.
5. #BigData can be industry specific, like unstruc’d text in insurance, healthcare & gov.
6. Machine data is special area of #BigData, with as yet untapped biz value & opportunity.
Reasons for Managing Big Data Well
7. Why manage #BigData? Keep pace w/growth, biz ROI, extend ent data arch, new apps.
8. Want to get biz value from #BigData? Manage #BigData for purposes of advanced #analytics.
9. #BigDataMgt yields larger samples for apps that need it: 360° views, risk, fraud, customer seg.
10. #TDWI SURVEY SEZ: 89% feel #BigDataMgt is opportunity. Mere 11% think it’s a problem.
11. Key benefits of #BigDataMgt are better #analytics, datasets, biz value, sales/marketing.
12. Barriers to #BigDataMgt: low maturity, weak biz support, new design paradigms.
13. #BigDataMgt non-issues: bulk load, query speed, scalability, network bandwidth.
Strategies for Users’ Big Data Management Solutions
14. #TDWI SURVEY SEZ: 10% have #BigDataMgt solution in production; 10% in dev; 20% prototype; 60% nada. #TDWI Webinar Oct.8 http://bit.ly/BDMweb
15. #TDWI SURVEY SEZ: Most common strategy for #BigDataMgt: extend existing DataMgt systems.
16. #TDWI SURVEY SEZ: 2nd most common strategy for #BigDataMgt: deploy new DataMgt systems for #BigData.
17. #TDWI SURVEY SEZ: 30% have no strategy for #BigDataMgt though they need one.
18. #TDWI SURVEY SEZ: 15% have no strategy for #BigDataMgt cuz they don’t need one.
Ownership and Use of Big Data Management Solutions
19. Some depts. & groups have own #BigDataMgt platforms, including #Hadoop. Beware teramart silos!
20. Trend: #BigDataMgt platforms supplied by IT as infrastructure. Imagine shared #Hadoop cluster.
21. Who does #BigDataMgt? analysts 22%; architects 21%; mgrs 21%; tech admin 13%; app dev 11%.
Tech Specs for Big Data Management Solutions
22. #TDWI SURVEY SEZ: 97% of orgs manage structured #BigData, followed by legacy, semi-struc, Web data etc.
23. Most #BigData stored on trad drives, but solid state drives & in-memory functions are gaining.
24. #TDWI SURVEY SEZ: 10-to-99 terabytes is the norm for #BigData today.
25. #TDWI SURVEY SEZ: 10% have broken the 1 petabyte #BigData barrier. Another 13% will within 3 years.
A Few Best Practices for Managing Big Data
26. For open-ended discovery-oriented #analytics, manage #BigData in original form wo/transformation.
27. Reporting and #analytics are different practices; managing #BigData for each is, too.
28. #BigData needs data standards, but different ones compared to other enterprise data.
29. Streaming #BigData is easy to capture & manage offline, but tough to process in #RealTime.
30. Non-SQL, non-relational platforms are coming on strong; BI/DW needs them for diverse #BigData.
Want to learn more about managing big data?
For a much more detailed discussion—
in a traditional publication!—get the TDWI Best Practices Report, titled
Managing Big Data, available in a PDF file via a free download.
You can also register for and replay my
TDWI Webinar, where I present the findings of
Managing Big Data.
Please consider taking courses at the
TDWI World Conference in Boston, October 20–25, 2013. Enroll online.
============================
Philip Russom is the research director for data management at TDWI. You can reach him at
[email protected] or follow him as @prussom on Twitter.
Posted by Philip Russom, Ph.D.0 comments
Treat them differently, if you want to get the most out of each.
By Philip Russom, TDWI Research Director for Data Management
I regularly get somewhat off-base questions from users who are in the thick of implementing or growing their analytic programs, and therefore get a bit carried away. Here’s a question I’ve heard a lot recently: “Our analytic applications generate so many insights that I should decommission my enterprise reporting platform, right?” And here’s a related question: “Should we implement Hadoop to replace our data warehouse and/or reporting platform?”
The common misconception I perceive behind these questions (which makes them “off-base” in my perception) is that people seem to be forgetting that analytics and reporting are two different practices. Analytics and reporting serve different user constituencies, produce different deliverables, prepare data differently, and support organizational goals differently. Despite a fair amount of overlap, I see analytics and reporting as complementary, which means you most likely need both and neither will replace the other. Furthermore, due to their differences, each has unique tool and data platform requirements that you need to satisfy, if you’re to get the most out of each.
Allow me to net it out with a few sweeping generalizations.
Reporting is mostly about entities and facts you know well, represented by highly polished data that you know well. And that data usually takes the form of carefully modeled and cleansed data with rich metadata and master data that’s managed in a data warehouse. In fact, it’s difficult to separate reporting and data warehouses, because most users designed their DWs first and foremost as a repository for reporting and similar practices such as OLAP, performance management, dashboards, and operational BI.
I regularly hear claims that Hadoop can replace a true DW. But I doubt this, because the current state of Hadoop cannot satisfy the data requirements of enterprise reporting near as well as the average DW can. Ultimately, it’s not about the warehouse per se; it’s about practices a DW supports well, such as reporting. I reserve the right to change my mind in the future, because Hadoop gets more sophisticated almost daily. My real point: most enterprise reporting depends on a DW for success, so keep and protect the DW.
Advanced analytics enables the discovery of new facts you didn’t know, based on the exploration and analysis of data that’s probably new to you. New data sources generally tell you new things, which is one reason organizations are analyzing big data more than ever before. Unlike the pristine data that reports operate on, advanced analytics works best with detailed source data in its original (even messy) form, using discovery oriented technologies, such as mining, statistics, predictive algorithms, and natural language processing. Sure, DWs can be expanded to support some forms of big data and advanced analytics. But the extreme volumes and diversity of big data are driving more and more users to locate big data on a platform besides a DW, such as Hadoop, DW appliances, or columnar databases.
I personally think that providing separate data platforms for reporting and analytics is a win-win data strategy. It frees up capacity on the DW, so it can continue growing and supporting enterprise reporting plus related practices. And it gives advanced analytics a data platform that’s more conducive to exploration and discovery than the average DW is.
Reporting is like a “high-volume business,” whereas analytics is like a “high-value business.” For example, with so-called enterprise business intelligence, thousands of concurrent report consumers access tens of thousands of reports that are refreshed nightly. By comparison, a small team of data analysts can transform an organization with a few high-value insights, such as new customer segments, visibility into costs, correlations between supplies and product quality, fraud detection, risk calculations, and so on. For completely different reasons, you need both reporting and analytics to serve the full range of user constituencies and provide many different levels of information and insight.
Most reports demand numeric precision, whereas most analyses don’t. Think financial reports (accurate to the penny) versus website page view reports (where guesstimates are fine).
Most enterprise reports require an audit trail, whereas few analyses do. Think regulatory reports versus the scores of an analytic model for customer churn.
Data management techniques differ. Squeaky clean report data demands elaborate data processing (for ETL, quality, metadata, master data, and so on), whereas preparing raw source data for analytics is simpler, though at higher levels of scale.
CONCLUSIONS: Despite some overlap, enterprise reporting and advanced analytics are so different as to be complementary. Hence, neither will replace the other. Both do important things for an information-driven organization, so you must give each what it needs for success, both at the tool level and at the data management level. Taking seriously the data requirements of big data analytics may lead you to implement Hadoop; but that doesn’t mean that Hadoop will replace a DW, which is still required to satisfy the data requirements of reporting and related practices, such as OLAP, performance management, dashboards, and operational BI.
Posted by Philip Russom, Ph.D.0 comments
As I mentioned in my last blog post, I am in the process of gathering survey data for the TDWI Best Practices Report about predictive analytics. Right now, I'm in the data analysis phase. It turns out (not surprisingly) that one of the biggest barriers to adoption of predictive analytics is understanding how the technology works. Education is definitely needed as more advanced forms of analytics move out to less experienced users.
With regard to education, coincidentally I had the pleasure of speaking to Eric Siegel recently about his book, Predictive Analytics: The Power to Predict Who Will Click, Buy, Lie, or Die (www.thepredictionbook.com). Eric Siegel is well known in analytics circles. For those who haven’t read the book, it is a good read. It is business focused with some great examples of how predictive analytics is being used today.
Eric and I focused our discussion on one of the more technical chapters in the book that addresses the problem known as overfitting (aka overlearning)—an important concept in predictive analytics. Overfitting occurs when a model describes the noise or random error rather than the underlying relationship. In other words, it occurs when your data fits the model a little too well. As Eric put it, "Not understanding overfitting in predictive analytics is like driving a car without learning where the brake pedal is."
While all predictive modeling methods can overlearn, a decision tree is a good technique for intuitively seeing where overlearning can happen. The decision tree is one of the most popular types of predictive analytics techniques used today. This is because it is relatively easy to understand—even by the non-statistician—and ease of use is a top priority among end users and vendors alike.
Here's a simplified example of a decision tree. Let's say that you're a financial institution that is trying to understand the characteristics of customers who leave (i.e., defect or cancel). This means that your target variables are leave (yes) and don't leave (no). After (hopefully) visualizing or running some descriptive stats to get a sense of the data, and understanding the question being asked, the company puts together what's called a training set of data into a decision tree program. The training set is a subset of the overall data set in terms of number of observations. In this case it might consist of attributes like demographic and personal information about the customer, size of monthly deposits, how long the customer has been with the bank, how long the customer has used online banking, how often they contact the call center, and so on.
Here's what might come out:

The first node of the decision tree is total deposit/month. This decision tree is saying that if a customer deposits more than $4K per month and is using online bill pay for more than two years, they are not likely to leave (there would be probabilities associated with this). However, if they have used online banking for less than two years and contacted the call center X times, there may be a different outcome. This makes sense intuitively. A customer who has been with the bank a long time and is already doing a lot of online bill paying might not want to leave. Conversely, a customer who isn't doing a lot of deposits and who has made a lot of calls to the call center might be having trouble with the online bill pay. You can see that the tree could branch down and down, each branch with a different probability of an outcome, either yes or no.
Now, here's the point about overfitting. You can imagine that this decision tree could branch out bigger and bigger to a point where it could account for every case in the training data, including the noisy ones. For instance, a rule with a 97% probability might read, "If customer deposits more than $4K a month and has used online bill pay for more than two years, and lives in ZYX, and is greater than 6 feet tall, then they will leave." As Eric states in his book, "Overlearning is the pitfall of mistaking noise for information, assuming too much about what has been shown in the data." If you give the decision tree enough variables, there are going to be spurious predictions.
The way to detect the potential pitfall of overlearning is apply a set of test data to the model. The test data set is a "hold out"; sample. The idea is to see how well the rules perform with this new data. In the example above, there is a high probability that the spurious rule above won't pan out in the test set.
In practice, some software packages will do this work for you. They will automatically hold out the test sample before supplying you with the results. The tools will show you the results on the test data. However, not all do, so it is important to understand this principle. If you validate your model using hold-out data, then overfitting does not have to be a problem.
I want to mention one other point here about noisy data. With all the discussion in the media about big data, there has been a lot said about people being misled by noisy big data. As Eric notes, "If you checking 500K variables you'll have bad luck eventually—you'll find something spurious." However, chances are that this kind of misleading noise is from an individual correlation, not a model. There is a big difference. People tend to equate predictive analytics with big data analytics. The two are not synonymous.
Are there issues with any technique? Of course. That's why education is so important. However, there is a great deal to be gained from predictive analytics models, as more and more companies are discovering.
Posted by Fern Halper, Ph.D.0 comments
Hadoop has limitations. But the relational database management systems used for data warehousing do, too. Luckily, their strengths are complementary.
By Philip Russom, TDWI Research Director for Data Management
In a recent blog in this series, I discussed “The Roles of Hadoop” in evolving data warehouse architectures. (There’s a link to that blog at the end of this blog.) In response, a few people asked me (I’m paraphrasing): “Since the Hadoop Distributed File System (HDFS) is so useful, can it replace the relational database management system (RDBMS) that’s at the base of my current data warehouse and its architecture?”
The short answer is: “No.” The long answer is: “Not today, and probably not in the future.” The main reason is that Hadoop—in its current form—lacks (or is weak with) many of the functions that we depend on in our RDBMSs. As you’ll see in the list below, most of the RDBMS functions I have in mind enable feature-rich and high-performance access to stored data via SQL. Other functions concerns tools for data security and administration.
Just so you know where this blog is going: Hadoop has limitations, but the average data warehouse does, too. Luckily, the strengths and weaknesses of the two are complementary (for the most part). When you integrate Hadoop and an RDBMS, they fill in each other’s holes and provide a more broadly capable data warehouse architecture than has been possible until now.
Hadoop’s Limitations Relative to RDBMSs Used for Data Warehousing
Despite all the goodness of Hadoop I described in a previous blog, there are areas within data warehouse architectures where HDFS isn’t such a good fit:
RDBMS functionality. HDFS is a distributed file system and therefore lacks capabilities we expect from relational database management systems (RDBMSs), such as indexing, random access to data, support for standard SQL, and query optimization. But that’s okay, because HDFS does things RDBMSs do not do as well, such as managing and processing massive volumes of file-based, unstructured data. For minimal DBMS functionality (though not fully relational), users can layer HBase over HDFS, as well as the query framework called Hive.
Low-latency data access and queries. HDFS’s batch-oriented, serial-execution engine means that it’s not the best platform for real-time or speedy data access or queries. Furthermore, Hadoop lacks mature query optimization. Hence, the selective random access to data and iterative ad hoc queries that we take for granted with RDBMSs are alien to Hadoop.
An RDBMS integrated with Hadoop can provide needed query support. HBase is a possible solution, if all you need is a record store, not a full-blown DBMS. And upcoming improvements to Hadoop Hive and the new Impala query engine will address some of the latency issues.
Streaming data. HDFS and other Hadoop products can capture data from streaming sources (Web servers, sensors, machinery) and append it to files. But, being inherently batch, they are ill-equipped to process that data in real time. In my opinion at this date, such extremes of real-time analytics are best done with specialized tools for complex event processing (CEP) and/or operational intelligence (OI) from third-party vendors.
Granular security. Hadoop today includes a few security features, such as file-permission checks, access control for job queues, and service-level authorization. Add-on products that provide encryption and LDAP integration are available for Hadoop from a few third-party vendors. Since HDFS is not a DBMS (and Hadoop data doesn’t necessarily come in relational structures), don’t expect granular security at the row or field level, as in an RDBMS.
Administrative tools. According to a TDWI survey, security is Hadoop users’ most pressing need, followed by a need for better administrative tools, especially for cluster deployment and maintenance. The good news is that a few vendors offer tools for Hadoop administration, and an upgrade of open-source Ambari is coming.
SQL-based analytics. With the above latency limitations in mind, HDFS is a problematic choice for workloads that are iterative and query based, as with SQL-based analytics. Furthermore, Hadoop products today have limited support for standard SQL. A number of vendor products (from RDBMSs to data integration and reporting tools) can provide SQL support today, and open-source Hadoop has new incubator projects that will eventually provide adequate support for SQL. These are critical if Hadoop is to become a productive part of a SQL-driven data warehouse architecture.
I’m not making up these limitations for Hadoop. The list is based on survey results and user interviews, as reported in my 2013 TDWI Best Practices Report:
Integrating Hadoop into BI and Data Warehousing.
In Defense of Hadoop
My list of limitations might seem like “Hadoop bashing” to some readers, but that is not what I intend. So let me restate what I stated positively in the last blog: “HDFS and other Hadoop tools promise to extend and improve some areas within data warehouse architectures.”
Sure, Hadoop’s help is limited to “some areas.” But the fantastically fortuitous fact is that most of Hadoop’s strengths are in areas where most warehouses and BI technology stacks are weak, such as unstructured data, outrageously large data sets, non-SQL algorithmic analytics, and the flood of files that’s drowning many of us. Conversely, Hadoop’s limitations (as discussed above) are mostly met by mature functionality available today from a wide range of RDBMS types (OLTP databases, columnar databases, DW appliances, etc.), plus admin tools. In that light, I hope it’s clear that Hadoop and the average data warehouse are complementary (despite a bit of overlap), so it’s unlikely that one could replace the other, as I am often asked.
Integrating Hadoop with an RDBMS Alleviates the Limitations of Both
The trick, of course, is making HDFS and an RDBMS work together optimally. To that end, one of the critical success factors for assimilating Hadoop into evolving data warehouse architectures is the improvement of interfaces and interoperability between HDFS and RDBMSs. Luckily, this is well under way, due to efforts from software vendors and the open source community. And technical users are starting to leverage HDFS/RDBMS integration.
For example, an emerging best practice among DW professionals with Hadoop experience is to manage diverse big data in HDFS, but process it and move the results (via ETL or other data integration media) to RDBMSs (elsewhere in the DW architecture) that are more conducive to SQL-based analytics. HDFS serves as a massive data staging area. A similar best practice is to use an RDBMS as a front-end to HDFS data; this way, data is moved via queries (whether ad hoc or standardized), not via ETL jobs. HDFS serves as a large, diverse operational data store. For more information about these practices, replay my recent TDWI Webinar: "
Ad Hoc Query Speed for Hadoop."
Other Blogs in the Evolving Data Warehouse Architectures series:
•
From EDW to DWE
•
The Role(s) of Hadoop
Posted by Philip Russom, Ph.D.0 comments
I am in the process of collecting data for my TDWI Best Practices Report on predictive analytics. The report will look at trends and best practices for predictive analytics. Some specific issues being investigated in the survey include: Who is using predictive analytics? What skills are needed for it? Is it being used in big data analysis? Is it being used in the cloud? What kind of data is being used for predictive analytics? What infrastructure is supporting it? What is the value that people using it are getting from it? The survey is slated to run another week, so if you haven’t had the chance to take it yet, please do. Here is the link:
I define predictive analytics as a statistical or data mining solution consisting of algorithms and techniques that can be used on both structured or unstructured data (together or individually) to determine future outcomes. It can be deployed for prediction, optimization, forecasting, simulation, and many other uses.
One of the first questions I ask in the survey is, “What is the status of predictive analytics in your organization?” To date, 37% of the respondents are currently utilizing predictive analytics, 53% are exploring it, and less than 10% have no plans to use it. Please note that this survey is not meant to determine the adoption of predictive analytics. The group who answered the survey might have been self-selecting in that those who are not using predictive analytics may have chosen not to respond to the survey, at all. One reason I asked this question was to be able to look at any differences between the two groups.
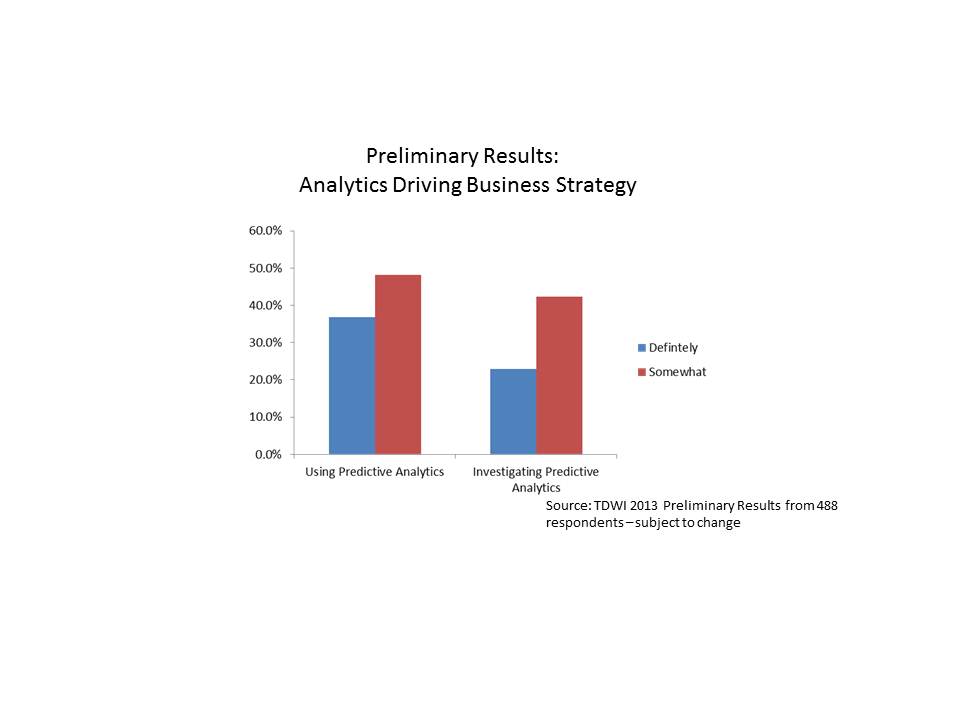
We asked the following question: “Would you say that analytics underpins your organization’s business strategy and drives day-to-day decisions?” The preliminary breakdown of responses is shown below.
Interestingly, those respondents who are already using predictive analytics were more likely to respond that analytics (in general) underpins their organization’s strategy and drives day-to-day decisions. About 37% of those respondents who are already using predictive analytics stated that analytics definitely underpins their day-to-day decision making, while only about 23% of those investigating the technology stated the same. Another way of looking at it is that 85% of those respondents using predictive analytics state that analytics is driving their day-to-day decisions in some way (i.e., answered definitely or somewhat), while only 65% of those who are investigating use analytics to drive day-to-day decisions and strategy.
Does this use of predictive analytics to drive strategy and decisions provide a benefit? It would appear so from preliminary results of the survey (of course subject to change). Close to 50% of the respondents who now use predictive analytics have actually measured a top or bottom line benefit or both from their predictive analytics efforts.
These preliminary results are quite interesting and I’m looking forward to getting all the data and analyzing the results! The TDWI Best Practices Report will be published later this year. I will continue to provide some updates here, along the way. So, stay tuned!
Posted by Fern Halper, Ph.D.0 comments