HDFS and other Hadoop tools promise to extend and improve some areas within data warehouse architectures
By Philip Russom, TDWI Research Director for Data Management
In a TDWI survey I designed and ran in 2012, 88% of the users surveyed reported that the Hadoop ecosystem of products is a business opportunity (not a technology problem) because it enables new types of applications. When asked which types of applications benefit most from Hadoop, survey respondents chose (in priority order) big data analytics, advanced analytics (i.e., data mining, statistical analysis, and complex SQL), and discovery analytics. After these three analytic application types, respondents then chose two data management use cases for Hadoop, namely information exploration and complementing a data warehouse. Other data management uses seen in the survey include data archiving, transforming big data for analytics, and data staging.
If you pull together all the things I just mentioned, it’s quite a list of use cases in data warehousing for the Hadoop Distributed File System (HDFS) and other Hadoop tools (MapReduce, Hive, HBase, HCatalog, Impala, etc.). And many of these—if implemented in a multi-platform data warehouse environment (DWE)—would have a strong influence on the architecture of that data environment.
Promising Uses of Hadoop that Impact DW Architectures
I see a handful of areas in data warehouse architectures where HDFS and other Hadoop products have the potential to play positive roles:
Data staging. A lot of data processing occurs in a DW’s staging area, to prepare source data for specific uses (reporting, analytics, OLAP) and for loading into specific databases (DWs, marts, appliances). Much of this processing is done by homegrown or tool-based solutions for extract, transform, and load (ETL). Imagine staging and processing a wide variety of data on HDFS.
For users who prefer to hand-code most of their solutions for extract, transform, and load (ETL), they will most likely feel at home in code-intense environments like Apache MapReduce. And they may be able to refactor existing code to run there. For users who prefer to build their ETL solutions atop a vendor tool, the community of vendors for ETL and other data management tools is rolling out new interfaces and functions for the entire Hadoop product family.
Note that I’m assuming that (whether you use Hadoop or not), you should physically locate your data staging area(s) on standalone systems outside the core data warehouse, if you haven’t already. That way, you preserve the core DW’s capacity for what it does best: squeaky clean, well-modeled data (with an audit trail via metadata and master data) for standard reports, dashboards, performance management, and OLAP. In this scenario, the standalone data staging area(s) offload most of the management of big data, archiving source data, and much of the data processing for ETL, data quality, and so on.
Data archiving. When organizations embrace forms of advanced analytics that require detail source data, they amass large volumes of source data, which taxes areas of the DW architecture where source data is stored. Imagine managing detailed source data as an archive on HDFS.
You probably already do archiving with your data staging area, though you probably don’t call it archiving. If you think of it as an archive, maybe you’ll adopt the best practices of archiving, especially information life cycle management (ILM), which I feel is valuable but woefully vacant from most DWs today. Archiving is yet another thing the staging area in a modern DW architecture must do, thus another reason to offload the staging area from the core DW platform.
Traditionally, enterprises had three options when it came to archiving data: leave it within a relational database, move it to tape or optical disk, or delete it. Hadoop’s scalability and low cost enable organizations to keep far more data in a readily accessible online environment. An online archive can greatly expand applications in business intelligence, advanced analytics, data exploration, auditing, security, and risk management.
Multi-structured data. Relatively few organizations are getting BI value from semi-structured and unstructured data, despite years of wishing for it. Imagine HDFS as a special place within your DW environment for managing and processing semi-structured and unstructured data. Another way to put it is: imagine not stretching your RDBMS-based DW platform to handle data types that it’s not all that good with.
One of Hadoop’s strongest complements to a DW is its handling of semi-structured and unstructured data. But don’t go thinking that Hadoop is only for unstructured data; HDFS handles the full range of data, including structured forms, too. In fact, Hadoop can manage just about any data you can store in a file and copy into HDFS.
Processing flexibility. Given its ability to manage diverse multi-structured data, as I just described, Hadoop’s NoSQL approach is a natural framework for manipulating non-traditional data types. Note that these data types are often free of schema or metadata, which makes them challenging for SQL-based relational DBMSs. Hadoop supports a variety of programming languages (Java, R, C), thus providing more capabilities than SQL alone can offer.
In addition, Hadoop enables the growing practice of “late binding.” Instead of transforming data as it’s ingested by Hadoop (the way you often do with ETL for data warehousing), which imposes an a priori model on data, structure is applied at runtime. This, in turn, enables the open-ended data exploration and discovery analytics that many users are looking for today.
Advanced analytics. Imagine HDFS as a data stage, archive, or twenty-first-century operational data store that manages and processes big data for advanced forms of analytics, especially those based on MapReduce, data mining, statistical analysis, and natural language processing (NLP). There’s much to say about this; in a future blog I’ll drill into how advanced analytics is one of the strongest influences on data warehouse architectures today, whether Hadoop is in use or not.
Stay tuned, because I’ll soon post more blogs about evolving data warehouse architectures. In the meantime, please read the new TDWI Checklist “
Where Hadoop Fits in Your Data Warehouse Architecture.”
Other blogs in the Evolving Data Warehouse Architectures series:
•
From EDW to DWE
Posted by Philip Russom, Ph.D.0 comments
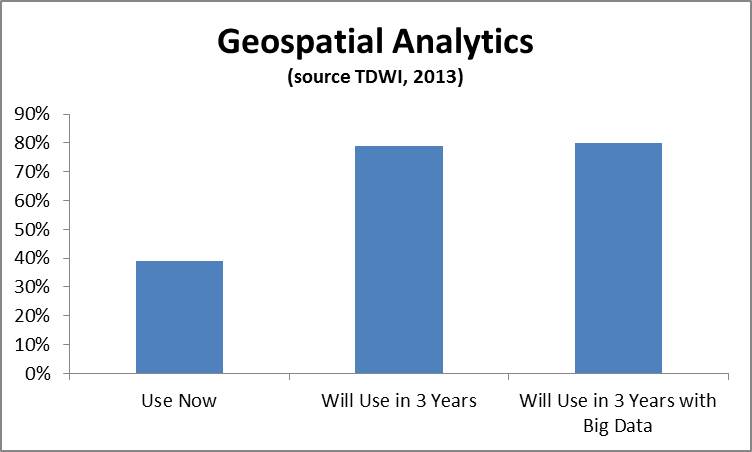
Geospatial data can be extremely powerful for a wide variety of use cases. Geospatial analysis – i.e. the practice of incorporating spatial characteristics in various kinds of analysis- has been incorporated in BI and visualization solutions for at least several years. Recently I’ve been hearing a lot from vendors about geospatial applications and using geospatial data in a range of more advanced analytics. In a recent TDWI technology survey, you can see that the geospatial analytics is growing in importance. We asked the respondents, “What kind of analytics are you currently using in your organization today to analyze data? In three years?” and “What kinds of techniques and tools is your organization using for big data analysis both today and in three years?” In the figure below, the 39% of respondents were currently using geospatial analysis and this number jumped to 79% in three years. The number of respondents answering affirmatively that geospatial analysis would be used in their big data solutions in three years was 81%.
Companies are becoming excited by the prospect of incorporating geospatial data into analysis. In terms of more advanced analytics, here are few examples of the kinds of analysis I’ve been hearing about:
- Predictive analytics. Geo-location data is being incorporated into predictive analytics. The most recent example of this is KXEN (www.kxen.com) announcing support for geo-location in its predictive analytics solution. KXEN will support data sources such as GPS, phone calls, machine sensors, geo-referenced signals, and social media. This includes capabilities for location-awareness, co-location, and path identification. For instance, marketers could use this kind of data to determine how likely someone is to purchase something at a store based on the path they took to get there (based on what others who took similar paths with a similar profile did) and offer a coupon based on this.
- Operational Intelligence. Operational intelligence incorporates analytics as part of a business process. Companies like Vitria (www.vitria.com) that provide operational intelligence solutions, support geospatial data. For instance, a wireless telephone company that monitors its network could use location data to determine which cell tower to fix based on where their high value customers are located.
- Situational Intelligence. Situational intelligence is a technique that integrates and correlates large volumes of multidimensional real time and historical data to identify and act on a problem. Part of that data is often geospatial For example, companies like Space Time Insight (www.spacetimeinsight.com) provide this kind of solution to help companies that deal with physical assets. Visualizing and analyzing this data can help answer questions like what happened, where did it happen, and why did it happen. Companies such as utility companies would use this information to a pinpoint problem and find the closest person to fix it.
I expect to hear a lot more about geospatial data and geospatial analysis moving forward. I’ll be writing more on the topic in the second half of 2013 and in 2014. Stay tuned.
Posted by Fern Halper, Ph.D.0 comments
Predictive analytics, a technology that has been around for decades has gotten a lot of attention over the past few years, and for good reason. Companies understand that looking in the rear-view mirror is not enough to remain competitive in the current economy. Today, adoption of predictive analytics is increasing for a number of reasons including a better understanding of the value of the technology, the availability of compute power, and the expanding toolset to make it happen. In fact, in a recent TDWI survey at our Chicago World Conference earlier this month, more than 50% of the respondents said that they planned to use predictive analytics in their organization over the next three years. The techniques for predictive analytics are being used on both traditional data sets as well as on big data.
Here are five trends that I’m seeing in predictive analytics:
- Ease of use. Whereas in the past, statisticians used some sort of scripting language to build a predictive model, vendors are now making their software easier to use. This includes hiding the complexity of the model building process and the data preparation process via the user interface. This is not a new trend but it is worth mentioning because it opens up predictive analytics to a wider audience such as marketing. For example, vendors such as Pitney Bowes, Pegasystems, and KXEN provide solutions targeted to marketing professionals with ease of use as a primary feature. The caveat here, of course, is that marketers still need the skills and judgment to make sure the software is used properly.
- Text hits the mainstream in predictive analytics. The kind of data being used as part of the predictive analytics process continues to grow in scope. For example, some companies are routinely using text data to improve the lift of their predictive models because it helps provide the “why” behind the “what”. Predictive analytics providers such as IBM and SAS provide text analytics as part of their solution. Others, such as Angoss and Pegasystems have partnered with text analytics vendors (such as Lexalytics and Attensity) to integrate this functionality in their products.
- Geospatial data use is on the rise. Geospatial data is also becoming more popular for use in and with predictive analytics. For instance, geospatial predictive analytics is being used to predict crime and terrorism. On the business front, location based data is starting to be used in conjunction with predictive modeling to target specific offers to customers based on where they are (i.e. traveling from work, at home) and their behavior.
- Operationalizing the analytics for action. Operationalizing means making something part of a business process. For example, companies are using predictive analytics to predict maintenance failures, predict collections, predict churn, and the list goes on. In these examples, predictive models are actually incorporated into the business process of an organization. For example, if a customer takes a certain action that puts them at risk for churn, that customer’s information is routed to the appropriate department for action. In fact, the term “action” and “insight to action” has come up quite a bit in recent conversations I’ve had with vendors.
- Adaptive learning: I’ve heard this go by a number of names – adaptive intelligence, automated learning, and adaptive learning. The idea is about continuously learning. For example, a model to understand behavior might be deployed against customer data. As the data changes, the model might change too. This kind prediction could also work against streaming data. Adaptive intelligence is still pretty early in the adoption cycle, but I expect it to increase.
These are just a few of the trends that I’m seeing in predictive analytics. As the technology continues to be adopted, new trends will certainly emerge. I used predictive analytics back in the late 1980s when I was at AT&T to understand customer behavior and I’m very happy to see that it’s a technology whose time has finally come! I’m now starting work on TDWI’s Best Practices Report on Predictive Analytics. Expect more from me on this topic in the future.
Posted by Fern Halper, Ph.D.0 comments
By Philip Russom, TDWI Research Director
Think about everything you know about data management, including its constituent disciplines for integration, quality, master data, metadata, data modeling, event processing, data warehousing, governance, administration, capacity planning, hand coding, and so on. Now, write down everything you know on a series of index cards that are about the same size as playing cards. Next, do some reading and studying to determine the new things you need to learn about managing so-called “big data,” and write those on more index cards. Finally, shuffle the index cards and deal them into several large hands, as you would do with playing cards.
That’s pretty much what will happen to data management in the next several years, under the influence of big data and related phenomena like advanced analytics, real-time operation, and multi-structured data. You won’t stop doing the old tried-and-true practices, and the new stuff won’t replace the old best practices. You’ll play every card in the newly expanded deck, but in hands, suites, and straights that are new to you, as well as at unprecedented levels of scale, speed, complexity, and concurrency. And every hand dealt from the deck will require tweaking and tuning to make it perform at the new level.
The result is
Big Data Management, the next generation of data management best practices and technologies, driven by new business and technical requirements for big data and related practices for analytics, real time, and diverse data types. Big Data Management is an amalgam of old and new techniques, best practices, teams, data types, and home-grown or vendor-built functionality. One assumption is that all these are being expanded and realigned so businesses can fully leverage big data, not merely manage it. Another assumption is that big data will eventually assimilate into enterprise data.
To help user organizations understand and embrace the next generation of data management, TDWI has commissioned a report titled: “
Managing Big Data.” I will research and write this 36-page report. It will catalog new user practices and technical functions in Big Data Management, as well as explain how the older ones need to be adjusted to serve the new world of big data. This report will bring readers up-to-date, so they can make intelligent decisions about which tools, techniques, and team structures to apply to their next-generation Big Data Management solutions. TDWI will publish the report “Managing Big Data” on or about October 1, 2013.
========================================================
Got #BigData? How do you manage it? Share your experiences and opinions by taking the
TDWI survey for the upcoming report on “Managing Big Data,” If you complete the survey, TDWI will send you an email explaining how to download a free copy of the report in October.
Thanks! I really appreciate you taking the survey.
Posted by Philip Russom, Ph.D.0 comments
With all of the research I’ve been doing around cloud computing over the past few years, I’ve noticed something very disturbing about how people use the word premises. I’ve blogged about this before but it merits repeating on my TDWI blog. Maybe it’s because I come from a telecommunications background that this bothers me so much – but has anyone else noticed that people are misusing the words premise/premises when describing aspects of the cloud? The proper term is generally premises, people, as in – on your premises (see below).
From Dictionary.com
Premise: a proposition supporting or helping to support a conclusion, a statement considered to be true.
Premises: a tract of land including its buildings.
Therefore, when discussing where servers, services, etc. are located, for instance, you should use the term premises.
Even vendors in the space make this mistake and I cringe every time I hear it. I used to correct them, but I’ve given up doing that. I could list hundreds, if not thousands, of examples of this error. Has the definition of the word changed and I’m missing something? Or, has the word been used incorrectly so many times that it doesn’t matter anymore? My POV: It still matters.
Posted by Fern Halper, Ph.D.0 comments
Blog by Philip Russom
Research Director for Data Management, TDWI
To help you better understand how Hadoop can be integrated into business intelligence (BE) and data warehousing (DW) and why you should care, I’d like to share with you the series of 27 tweets I recently issued on the topic. I think you’ll find the tweets interesting, because they provide an overview of these issues and best practices in a form that’s compact, yet amazingly comprehensive.
Every tweet I wrote was a short sound bite or stat bite drawn from my recent TDWI report “Integrating Hadoop in Business Intelligence and Data Warehousing.” Many of the tweets focus on a statistic cited in the report, while other tweets are definitions stated in the report.
I left in the arcane acronyms, abbreviations, and incomplete sentences typical of tweets, because I think that all of you already know them or can figure them out. Even so, I deleted a few tiny URLs, hashtags, and repetitive phrases. I issued the tweets in groups, on related topics; so I’ve added some headings to this blog to show that organization. Otherwise, these are raw tweets.
Status of Users’ Efforts at Integrating Hadoop into BI/DW
1. #TDWI SURVEY SEZ: Shocking 26% don’t know what #Hadoop is. Ignorance of #Hadoop too common in BI & IT.
2. #TDWI SURVEY SEZ: Mere 18% have had experience w/#HDFS & #Hadoop. Only 2/3rds of 18% have deployed HDFS.
3. Use of #Hadoop Distributed File System (#HDFS) will go from scarce to ensconced in 3 yrs.
4. #TDWI SURVEY SEZ: Only 10% have deployed #HDFS today, yet another 63% expect to within 3 yrs.
5. #TDWI SURVEY SEZ: A mere 27% say their organization will never deploy #HDFS.
Hadoop Technologies Used Today in BI/DW
6. #TDWI SURVEY SEZ: #MapReduce (69%) & #HDFS (67%) are the most used #Hadoop techs today.
7. #TDWI SURVEY SEZ: #Hive (60%) & #HBase (54%) are the #Hadoop techs most commonly used w/#HDFS.
8. #TDWI SURVEY SEZ: #Hadoop technologies used least today are: Chukwa, Ambari, Oozie, Hue, Flume.
9. #TDWI SURVEY SEZ: #Hadoop techs etc poised for adoption: Mahout, R, Zookeeper, HCatalog, Oozie.
What Hadoop will and won’t do for BI/DW
10. #TDWI SURVEY: 88% say #Hadoop for BI/DW (#Hadoop4BIDW) is opportunity cuz enables new app types.
11. #TDWI SURVEY: Can #Hadoop Distributed File System (#HDFS) replace #EDW? Mere 4% said yes.
12. #TDWI SURVEY: Can #Hadoop Distributed File System (#HDFS) augment #EDW? Mere 3% said no.
13. #TDWI SURVEY: Can #Hadoop Distributed File System (#HDFS) expand your #Analytics? Mere 1% said no.
Hadoop Use Case with BI/DW
14. #TDWI SURVEY: 78% of respondents say #HDFS complements #EDW. That’s leading use case in survey.
15. #TDWI SURVEY: Other #HDFS use cases: archive (52%), data stage (41%), sandbox (41%), content mgt (35%).
Hadoop Benefits and Barriers
16. #TDWI SURVEY: Best #Hadoop4BIDW benefits: #BigData source, #analytics, data explore, info discover.
17. #TDWI SURVEY: Worst #Hadoop4BIDW barriers: lacking skill, biz case, sponsor, cost, lousy #Hadoop tools.
Best Practices among Users who’ve deployed Hadoop
18. #TDWI SURVEY: Why adopt #Hadoop4BIDW? Scale, augment DW, new #analytics, low cost, diverse data types.
19. #TDWI SURVEY: Job titles of #Hadoop4BIDW workers: data developer, architect, scientist, analyst.
20. Organizations surveyed with #Hadoop in production average 12 clusters; median is 2.
21. Orgs surveyed with #Hadoop in production average 45 nodes per cluster; median is 12.
22. Orgs surveyed with #Hadoop in production manage a few TBs today but expect ~.5PB within 3yrs.
23. Orgs surveyed with #Hadoop in production mostly load it via batch every 24 hrs.
24. #TDWI SURVEY: Worst #Hadoop functions: security, admin tools, namenode, data quality, loading, dev tools.
BI/DW Tools etc. Integrated Today & Tomorrow with Hadoop
25. #TDWI SURVEY: BI/DW tools commonly integrated with #Hadoop: #analytics, DWs, reporting, webservers, DI.
26. Other BI/DW tools integrated with #Hadoop: analytic DBMSs, #DataViz, OpApps, marts, DQ, MDM.
27. #TDWI SURVEY: Machinery (13%) & sensors (8%) are seldom integrated w/#Hadoop today, but coming.
Want to learn more about big data and its management?
Take courses at the TDWI World Conference in Chicago, May 5-10, 2013. Enroll online.
For a more detailed discussion – in a traditional publication! – get the TDWI Best Practices Report, titled “Integrating Hadoop into Business Intelligence and Data Warehousing,” which is available in a PDF file via a free download.
You can also register online for and replay my TDWI Webinar, where I present the findings of the TDWI report “Integrating Hadoop into BI/DW.”
Philip Russom is the research director for data management at TDWI. You can reach him at [email protected] or follow him as @prussom on Twitter.
Posted by Philip Russom, Ph.D.0 comments
Last week I attended the IBM Big Data at the Speed of Business Event at IBM’s Research facility in Almaden. At the event IBM announced multiple capabilities around its big data initiative including its new BLU Acceleration and IBM PureData System for Hadoop. Additionally, new versions of Infosphere Big Insights and Infosphere Streams (for data streams) were announced as enhancements to IBM’s Big Data Platform. A new version of Informix that includes time series acceleration was also announced.
The overall goal of these products is to make big data more consumable –i.e. to make it simple to manage and analyze big data. For example, IBM PureData System for Hadoop is basically Hadoop as an appliance, making it easier to stand up and deploy. Executives at the event said that a recent customer had gotten its PureData System “loading and interrogating data 89 minutes.” The solution comes packaged with analytics and visualization technology too. BLU Acceleration combines a number of technologies including dynamic in-memory processing and active compression to make it 8-25x faster for reporting and analytics.
For me, some of the most interesting presentations focused on big data analytics. These included emerging patterns for big data analytics deployments, dealing with time series data, and the notion of the contextual enterprise.
Big data analytics use cases. IBM has identified five big data use cases from studying hundreds of engagements it has done across 15 different industries. These high value use cases include:
- 360 degree view of a customer- utilizing data from internal and external sources such as social chatter to understand behavior and “seminal psychometric markers” to gain insight into customer interactions.
- Security/Intelligence- utilizing data from sources like GPS devices and RFID tags and consuming it at a rate to protect individual safety from fraud or cyber attack.
- Optimizing infrastructure- utilizing machine generated data such as IT log data, web data, and asset tags to a improve service or monetize it.
- Data warehouse augmentation- extending the trusted data in a data warehouse by integrating other data with it like unstructured information.
- Exploration- visualizing and understanding more business data by unifying data across different silos to identify patterns or problems.
(for more information on these use cases there is a good podcast by Eric Sall)
Big data and time series. I was happy to see that Informix can handle time series data (it has been doing that for several years) and that the market is beginning to understand the value of time series data in big data analytics. According to IBM, this is being driven in part by the introduction of new technologies like RFID tags and smart meters. Think about a utility company collecting time series data from the smart meter on your house. This data can be analyzed not only to compute your bill, but to do more sophisticated analysis like predicting outages. Now, it will be faster to analyze this data because BLU Acceleration will be used with IBM Informix. This is a case of a new kind of data being analyzed using new technology.
The contextual enterprise. Michael Karasick, VP of IBM Research talked about the notion of the Contextual Enterprise which is a new holistic approach of dynamically building and accumulating context at scale from disparate data sources to deliver client value. These utilize data from what IBM calls systems of engagement (sources such as email, social data, media) together with traditional data sources in a gather, connect, reason, and adapt loop.
There is definitely a lot to wrap your head around in these big data announcements. The bottom line though is that the goal of these new products is to provide ease of use and improvements in performance and capabilities which can help improve big data analytics. The products can help improve what companies have already been doing with analytics because it is now faster to do it or they can help companies to perform new kinds of analysis that they couldn’t do before. That is what big data analytics is about.
Posted by Fern Halper, Ph.D.0 comments
By Philip Russom, TDWI Research Director
[
NOTE -- My new TDWI report “Integrating Hadoop into Business Intelligence (BI) and Data Warehousing (DW)” (Hadoop4BIDW) is finished and will be published in early April. I will broadcast the report’s Webinar on April 9, 2013 at noon ET. In the meantime, I’ll leak a few of the report’s findings in this blog series. Search Twitter for #Hadoop4BIDW, #Hadoop, and #TDWI to find other leaks. Enjoy!]
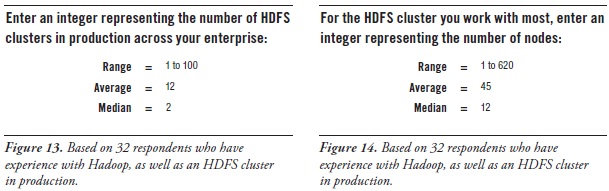
Number of HDFS clusters per enterprise. One way to measure the adoption of HDFS is to count the number of HDFS clusters per enterprise. Since far more people have downloaded HDFS and other Hadoop products than have actually put them to enterprise use, it’s best to only count those clusters that are in production use. The vast majority of survey respondents (and, by extension, most user organizations) do not have HDFS clusters in production. So, this report identified 32 respondents who do, and asked them about their clusters. (See Figure 13 above.)
When asked how many HDFS clusters are in production, 32 survey respondents replied in the range one to one hundred. Most responses were single digit integers, which drove the average number of HDFS clusters down to 12 and the median down to 2. Parsing users’ responses reveals that over half of respondents have only one or two clusters in production enterprise-wide at the moment, although one fifth have 50 or more.
Note that ownership of Hadoop products can vary, as discussed earlier, thereby affecting the number of HDFS clusters. Sometimes central IT provides a single, very large HDFS cluster for shared use by departments across an enterprise. And sometimes departments and development teams have their own.
Number of nodes per HDFS cluster. We can also measure HDFS cluster maturity by counting the number of nodes in the average cluster. Again, the most meaningful count comes from clusters that are in production. (See Figure 14 above.)
When asked how many nodes are in the HDFS cluster most often used by the survey respondent, respondents replied in the range one to six hundred and twenty, where one third of responses were single digit. That comes to 45 nodes per production cluster on average, with the median at 12. Half of the HDFS clusters in production surveyed here have 12 or fewer nodes, although one quarter have 50 or more.
To add a few more data points to this discussion, people who work in large Internet firms have presented at TDWI conferences, talking about HDFS clusters with approximately one thousand nodes. However, speakers discussing fairly mature HDFS usage specifically in data warehousing usually have clusters in the fifty to one-hundred node range. Proof-of-concept clusters observed by TDWI typically have four to eight nodes, whereas development clusters may have but one or two.
Want to learn more about big data and its management? Take courses at the TDWI World Conference in Chicago, May 5-10, 2013.
Enroll online.
Posted by Philip Russom, Ph.D.0 comments
By Philip Russom, TDWI Research Director
[
NOTE -- My new TDWI report “Integrating Hadoop into Business Intelligence (BI) and Data Warehousing (DW)” (Hadoop4BIDW) is finished and will be published in early April. I will broadcast the report’s Webinar on April 9, 2013. In the meantime, I’ll leak a few of the report’s findings in this blog series. Search Twitter for #Hadoop4BIDW, #Hadoop, and #TDWI to find other leaks. Enjoy!]
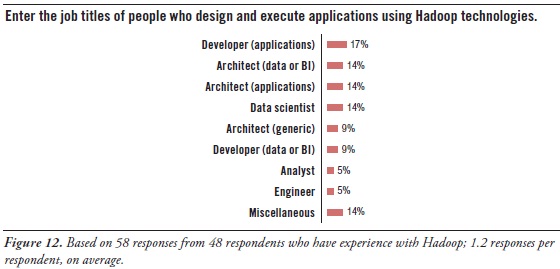
One way to get a sense of what kinds of technical specialists are working with HDFS and other Hadoop tools is to look at their job titles. So, this report’s survey asked a subset of respondents to enter the job titles of Hadoop workers. (See Figure 12 above.) Many users are concerned about acquiring the right people with the right skills for Hadoop, and this list of job titles can assist in that area.
Hadoop workers are typically architects, developers, data scientists, and analysts:
Architect. It’s interesting that the word architect appeared in more job titles than any other word, followed closely by the word developer. Among these, two titles stand out – data architect and application architect – plus miscellaneous titles like system architect and IT architect. Most architects (regardless of type) guide designs, set standards, and manage developers. So architects are most likely providing a management and/or governance function for Hadoop, since Hadoop has an impact on data, application, and system architectures.
Developer. Similar to the word architect, many job titles contained the word developer. Again, there’s a distinction between application developers and data (or BI) developers. Application developers may be there to satisfy Hadoop’s need for hand-coded solutions, regardless of the type of solution. And, as noted, some application groups have their own Hadoop cluster. The data and BI developers obviously bring their analytic expertise to Hadoop-based solutions.
Data Scientist. This job title has slowly gained popularity in recent years, and seems to be replacing the older position of business analyst. Another way to look at it is that some business analysts are proactively evolving into data scientists, because that’s what their organizations need from them. When done right, the data scientist’s job involves many skills, and most of those are quite challenging. For example, like a business analyst, the data scientist is also a hybrid worker who needs knowledge of both business and data (that is, data’s meaning, as well as its management). But the data scientist must be more technical than the average business analyst, doing far more hands-on work writing code, designing analytic models, creating ETL logic, modeling databases, writing very complex SQL, and so on. Note that these skills are typically required for high-quality big data analytics in a Hadoop environment, and the position of the data scientist originated for precisely that. Even so, TDWI sees the number of data scientists increasing across a wide range of organizations and industries, because they’re needed as analytic usage gets deeper and more sophisticated and as data sources and types diversify.
Analyst. Business analyst and data analyst job titles barely registered in the survey. Perhaps that’s because most business analysts rely heavily on SQL, relational databases, and other technologies for structured data, which are currently not well represented in Hadoop functionally. As noted, some analysts are becoming data scientists, as they evolve to satisfy new business requirements.
Miscellaneous. The remaining job titles are a mixed bag, ranging from engineers to marketers. This reminds us that big data analytics – and therefore Hadoop, too – is undergoing a democratization that makes it accessible to an ever-broadening range of end users who depend on data to do their jobs well.
Want more? Register for my Hadoop4BIDW Webinar, coming up April 9, 2013 at noon ET:
http://bit.ly/Hadoop13
Posted by Philip Russom, Ph.D.0 comments
By Philip Russom, TDWI Research Director
[NOTE -- My new TDWI report “Integrating Hadoop into Business Intelligence (BI) and Data Warehousing (DW)” (Hadoop4BIDW) is finished and will be published in early April. I will broadcast the report’s Webinar on April 9, 2013. In the meantime, I’ll leak a few of the report’s findings in this blog series. Search Twitter for #Hadoop4BIDW, #Hadoop, and #TDWI to find other leaks. Enjoy!]
This report considers Hadoop an ecosystem of products and technologies. Note that some are more conducive to applications in BI, DW, DI, and analytics than others; and certain product combinations are more desirable than others for such applications.
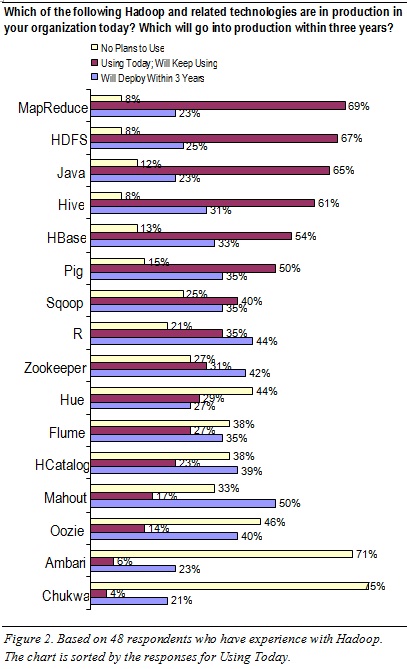
To sort out which Hadoop products are in use today (and will be in the near future), this report’s survey asked: Which of the following Hadoop and related technologies are in production in your organization today? Which will go into production within three years? Which will you never use? (See Figure 2 above.) These questions were answered by a subset of 48 survey respondents who claim they’ve deployed or used HDFS. Hence, their responses are quite credible, being based on direct hands-on experience.
HDFS and a few add-ons are the most commonly used Hadoop products today. HDFS is near the top of the list (67% in Figure 2), because most Hadoop-based applications demand HDFS as the base platform. Certain add-on Hadoop tools are regularly layered atop HDFS today:
- MapReduce (69%). For the distributed processing of hand-coded logic, whether for analytics or for fast data loading and ingestion
- Hive (60%). For projecting structure onto Hadoop data, so it can be queried using a SQL-like language called HiveQL
- HBase (54%). For simple, record-store database functions against HDFS’ data
MapReduce is used even more than HDFS. The survey results (which rank MapReduce slightly more common than HDFS) suggest that a few respondents in this survey population are using MapReduce today without HDFS, which is possible, as noted earlier. The high MapReduce usage also explains why Java and R ranked fairly high in the survey; these programming languages are not Hadoop technologies per se, but are regularly used for the hand-coded logic that MapReduce executes. Likewise, Pig ranked high in the survey, being a tool that enables developers to design logic (for MapReduce execution) without having to hand-code it.
Some Hadoop products are rarely used today. For example, few respondents in this survey population have touched Chukwa (4%) or Ambari (6%), and most have no plans for using them (75% and 71%, respectively). Oozie, Hue, and Flume are likewise of little interest at the moment.
Some Hadoop products are poised for aggressive adoption. For example, half of respondents (50%) say they’ll adopt Mahout within three years, with similar adoption projected for R (44%), Zookeeper (42%), HCatalog (40%), and Oozie (40%).
TDWI sees a few Hadoop products as especially up-and-coming. Usage of these will be driven up according to user demand. For example, users need analytics tailored to the Hadoop environment, as provided by Mahout (machine-learning based recommendations, classification, and clustering) and R (a programming language specifically for analytics). Furthermore, BI professionals are accustomed to DBMSs, and so they long for a Hadoop-wide metadata store and far better tools for HDFS administration and monitoring; these user needs are being addressed by HCatalog and Ambari, respectively, and therefore TDWI expects both to become more popular.
Want more? Register for my Hadoop4BIDW Webinar, coming up April 9, 2013 at noon ET: http://bit.ly/Hadoop13
Posted by Philip Russom, Ph.D.0 comments