
By Philip Russom, TDWI Research Director
[NOTE -- My new TDWI report “Integrating Hadoop into Business Intelligence (BI) and Data Warehousing (DW)” (Hadoop4BIDW) is finished and will be published in early April. I will broadcast the report’s Webinar on April 9, 2013. In the meantime, I’ll leak a few of the report’s findings in this blog series. Search Twitter for #Hadoop, #TDWI and #Hadoop4BIDW to find other leaks. Enjoy!]
The Hadoop Distributed File System (HDFS) and other Hadoop products show great promise for enabling and extending applications in BI, DW, DI, and analytics. But are user organizations actively adopting HDFS?
To quantify this situation, this report’s survey asked: When do you expect to have HDFS in production? (See Figure 1.) The question asks about HDFS, because in most situations (excluding some uses of MapReduce) an HDFS cluster must first be in placed before other Hadoop products and hand-coded solutions are deployed atop it. Survey results reveal important facts about the status of HDFS implementations. A slight majority of survey respondents are BI/DW professionals, so the survey results represent the broad IT community, but with a BI/DW bias.
-
HDFS is used by a small minority of organizations today. Only 10% of survey respondents report having reached production deployment.
-
A whopping 73% of respondents expect to have HDFS in production. 10% are already in production, with another 63% upcoming. Only 27% of respondents say they will never put HDFS in production.
-
HDFS usage will go from scarce to ensconced in three years. If survey respondents’ plans pan out, HDFS and other Hadoop products and technologies will be quite common in the near future, thereby having a large impact on BI, DW, DI, and analytics – plus IT and data management in general, and how businesses leverage these.
Figure 1. Based on 263 respondents: When do you expect to have HDFS in production?
10% = HDFS is already in production
28% = Within 12 months
13% = Within 24 months
10% = Within 36 months
12% = In 3+ years
27% = Never
Hadoop: Problem or Opportunity for BI/DW?
Hadoop is still rather new, and it’s often deployed to enable other practices that are likewise new, such as big data management and advanced analytics. Hence, rationalizing an investment in Hadoop can be problematic. To test perceptions of whether Hadoop is worth the effort and risk, this report’s survey asked: Is Hadoop a problem or an opportunity? (See Figure 3.)
-
The vast majority (88%) consider Hadoop an opportunity. The perception is that Hadoop products enable new applications types, such as the sessionization of Web site visitors (based on Web logs), monitoring and surveillance (based machine and sensor data), and sentiment analysis (based on unstructured data and social media data).
-
A small minority (12%) consider Hadoop a problem. Fully embracing multiple Hadoop products requires a fair amount of training in hand-coding, analytic, and big data skills that most BI/DW and analytics teams lack at the moment. But (at a mere 12%) few users surveyed consider Hadoop a problem.
Figure 3. Based on 263 respondents: Is Hadoop a problem or an opportunity?
88% = Opportunity – because it enables new application types
12% = Problem – because Hadoop and our skills for it are immature
Want more? Register for my Hadoop4BIDW Webinar, coming up April 9, 2013 at noon ET: http://bit.ly/Hadoop13
Posted by Philip Russom, Ph.D.0 comments
I’ve recently spent a lot of time talking to companies about how they’re using text analytics. By far, one of the biggest use cases for text analytics centers on understanding customer feedback and behavior. Some companies are using internal data such as call center notes or emails or survey verbatim to gather feedback and understand behavior, others are using social media, and still others are using both.
What are these end users saying about how to be successful with text analytics? Aside from the important best practices around defining the right problem, getting the right people, and dealing with infrastructure issues, I’ve also heard the following:
Best Practice #1 - Managing expectations among senior leadership. A number of the end-users I speak with say that their management often thinks that text analytics solutions will work almost out of the box and this can establish unrealistic expectations. Some of these executives seem to envision a big funnel where reams of unstructured text enter and concepts, themes, entities, and insights pop out at the other end. Managing expectations is a balancing act. On the one hand, executive management may not want to hear the details about how long it is going to take you to build a taxonomy or integrate data. On the other hand, it is important to get wins under your belt quickly to establish credibility in the technology because no one wants to wait years to see some results. That said, it is still important to establish a reasonable set of goals and prioritize them and to communicate them to everyone. End users find that getting senior management involved and keeping them informed with well-defined plans on a realistic first project can be very helpful in handling expectations.
Best Practice #2 – Manage expectations among business analysts (and statisticians). Most people who deal with text analysis believe that “looking at text data is very different than analyzing structured data.” It turns out that some analysts get uncomfortable when dealing with unstructured data because they’re used to building models with extremely high accuracy using well-understood structured data. The reality is that with unstructured text, you might only achieve 70-80 percent accuracy (for example, in sentiment analysis). Therefore, these analysts need to enter into the analysis with their eyes open to this ambiguity and decide what they can live with in terms of analysis. End-users I’ve spoken to say that this can take a little time and patience, but with some education, it does work.
Best Practice #3- Keep it visible. I have spoken with a number of companies that understand that in order for text analytics to keep a seat at the (executive) table it is important to keep it front and center. How do they do this? Some companies distribute ongoing analysis while others distribute daily customer quotes from unstructured data sources. Many find that the emotion and feeling in customer feedback can really capture the attention of senior leadership. Other end-users have cited the ability to “tell the story” with your text data, and that story can be very powerful and provide visibility to the analysis.
Best Practice #4 -Dig, Dig, Dig. Dig deeper than just monitoring. Many companies start off with social media analysis as the first part of their text analytics journey. However, many social media analytics platforms are nothing more than listening posts that will give you some hint as to the buzz around your product and if it is positive or negative. At the end of the day, that doesn’t provide you with much information. They may be a good first step in getting your feet wet. However, companies that are successful in utilizing text analytics tools believe that they are just touching the tip of the iceberg in the kinds of analysis they can perform with a text analytics tool. They are integrating data sources (i.e. structured and unstructured) and digging deep into the data to determine the why around the what of certain issues. This means visualizing the data as well as utilizing more sophisticated methods to analyze it.
Best Practice # 5- Actionable feedback requires a way to take action. Text analytics can provide you with significant insight as to the “why” of a behavior. However, you need to be in a position to make it actionable if you want to derive the most benefits from the technology. For instance, you may determine that a group of customers are unhappy about a certain product or that a feature you provide isn’t meeting expectations and that is why they are no longer customers. That’s great insight, but you need to be able to act on it. Of course, action can come in a number of flavors. It can be as simple as having a manual process in place to deal with the insights. Or it can become more sophisticated. For example, some are operationalizing a process by using tools that help to close the loop with their customers by routing comments to agents who can then reach out to these customers.
Of course, many of these best practices are useful for any kind of advanced analytics. However, as text data takes its place in organizations, it is essential not to forget them. It is also important to remember that there are differences between analyzing and utilizing structured and unstructured data – a topic I will explore further in future posts.
Posted by Fern Halper, Ph.D.0 comments
I am excited to join TDWI as the Research Director for Advanced Analytics. Of course, different people have different definitions for advanced analytics. Here’s how I define it. Advanced analytics provides algorithms for complex analysis of either structured or unstructured data. It includes sophisticated statistical models, machine learning, neural networks, text analytics and other advanced data mining techniques. Among its many use cases, it can be deployed to find patterns in data, prediction, optimization, forecasting, and stream mining. It typically does not include simple database query and reporting or OLAP cubes.
Clearly, big data and advanced analytics are becoming increasingly interconnected. The development of big data analytics has been driven by scientific research, the needs of Internet giants, and the requirements of large multi-national companies. However, more and more, organizations are realizing that big data -- both in-house, or that they can obtain from external sources -- might provide very valuable insight. Until recently, though, it was difficult to glean insight from this data because of cost, infrastructure, algorithmic, and other issues.
Many companies are interested in big data analytics but don’t know where to start. Others are early in their big data deployments and want to understand what they should be doing next. Therefore, one of the first projects I’m working on at TDWI is a Big Data Analytics Maturity Model. The maturity framework is divided into five categories, each with a series of subcategories and questions associated with those subcategories. For example, one category examines how organizational factors such as strategy, leadership, skills, funding, and culture play into your maturity in terms of big data analytics. Other categories examine factors related to infrastructure, data, analytics, and governance. All of this is related to best practices.
Since I just finished co-authoring Big Data for Dummies, this is a great project for me as I begin my career at TDWI. Please stay tuned!
Any thoughts, please let me know!
Posted by Fern Halper, Ph.D.0 comments
Blog by Philip Russom
Research Director for Data Management, TDWI
To help you better understand High-Performance Data Warehousing (HiPerDW) and why you should care about it, I’d like to share with you the series of 34 tweets I recently issued. I think you’ll find the tweets interesting, because they provide an overview of HiPerDW in a form that’s compact, yet amazingly comprehensive.
Every tweet I wrote was a short sound bite or stat bite drawn from my recent TDWI report on HiPerDW. Many of the tweets focus on a statistic cited in the report, while other tweets are definitions stated in the report.
I left in the arcane acronyms, abbreviations, and incomplete sentences typical of tweets, because I think that all of you already know them or can figure them out. Even so, I deleted a few tiny URLs, hashtags, and repetitive phrases. I issued the tweets in groups, on related topics; so I’ve added some headings to this blog to show that organization. Otherwise, these are raw tweets.
Defining High-Performance Data Warehousing (#HiPerDW)
1. The 4 dimensions of High-Performance Data Warehousing (#HiPerDW): speed, scale, complexity, concurrency.
2. High-performance data warehousing (#HiPerDW) achieves speed & scale, despite complexity & concurrency.
3. #HiPerDW 4 dimensions relate. Scaling requires speed. Complexity & concurrency inhibit speed & scale.
4. High-performance data warehousing (#HiPerDW) isn't just DW. #BizIntel, #DataIntegration & #Analytics must also perform.
5. Common example of speed via high-performance data warehousing (#HiPerDW) = #RealTime for #OperationalBI.
6. A big challenge to high-performance data warehousing (#HiPerDW) = Scaling up or out to #BigData volumes.
7. Growing complexity & diversity of sources, platforms, data types, & architectures challenge #HiPerDW.
8. Increasing concurrency of users, reports, apps, #Analytics, & multiple workloads also challenge #HiPerDW.
HiPerDW Makes Many Applications Possible
9. High-performance data warehousing (#HiPerDW) enables fast-paced, nimble, competitive biz practices.
10. Extreme speed/scale of #BigData #Analytics requires extreme high-performance warehousing (#HiPerDW).
11. #HiPerDW enables #OperationalBI, just-in-time inv, biz monitor, price optimiz, fraud detect, mobile mgt.
HiPerDW is An Opportunity
12. #TDWI SURVEY SEZ: High-performance data warehousing (#HiPerDW) is mostly opportunity (64%); sometimes problem (36%).
13. #HiPerDW is an opportunity because it enables new, broader and faster data-driven business practices.
14. #TDWI SURVEY SEZ: 66% say High Perf #DataWarehousing (#HiPerDW) is extremely important. 6% find it a non-issue.
15. #TDWI SURVEY SEZ: Most performance improvements are responses to biz demands, growth, or slow tools.
New Options for HiPerDW
16. Many architectures support High-Perf #DataWarehousing (#HiPerDW): MPP, grids, clusters, virtual, clouds.
17. #HiPerDW depends on #RealTime functions for: streaming data, buses, SOA, event processing, in-memory DBs.
18. Many hardware options support #HiPerDW: big memory, multi-core CPUs, Flash memory, solid-state drives.
19. Innovations for Hi-Perf #DataWarehousing (#HiPerDW) = appliance, columnar, #Hadoop, #MapReduce, InDB #Analytics.
20. Vendor tools are indispensible, but #HiPerDW still requires optimization, tweaks & tuning by tech users.
Benefits and Barriers for HiPerDW
21. #TDWI SURVEY SEZ: Any biz process or tech that’s #Analytics, #RealTime or data-driven benefits from #HiPerDW.
22. #TDWI SURVEY SEZ: Biggest barriers to #HiPerDW are cost, tool deficiencies, inadequate skills, & #RealTime.
Replacing DW to Achieve HiPerDW
23. #TDWI SURVEY SEZ: 1/3 of users will replace DW platform within 3 yrs to boost performance. #HiPerDW
24. #TDWI SURVEY SEZ: Top reason to replace #EDW is scalability. Second reason is speed. #HiPerDW
25. #TDWI SURVEY SEZ: The number of analytic datasets in 100-500+ terabyte ranges will triple. #HiPerDW
HiPerDW Best Practices
26. #TDWI SURVEY SEZ: 61% their top High-Performance DW method (#HiPerDW) is ad hoc tweaking & tuning.
27. #TDWI SURVEY SEZ: Bad news: Tweaking & tuning for #HiPerDW keeps developers from developing.
28. #TDWI SURVEY SEZ: Good news: Only 9% spend half or more of time tweaking & tuning for #HiPerDW.
29. #TDWI SURVEY SEZ: #HiPerDW methods: remodeling data, indexing, revising SQL, hardware upgrade.
30. BI/DW team is responsible for high-performance data warehousing (#HiPerDW), then IT & architects.
HiPerDW Options that will See Most Growth
31. #HiPerDW priorities for hardware = server memory, computing architecture, CPUs, storage.
32. #TDWI SURVEY SEZ: In-database #Analytics will see greatest 3-yr adoption among #HiPerDW functions.
33. #TDWI SURVEY SEZ: Among High-Perf #DataWarehouse functions (#HiPerDW), #RealTime ones see most adoption.
34. #TDWI SURVEY SEZ: In-memory databases will also see strong 3-yr growth among #HiPerDW functions.
FOR FURTHER STUDY:
For a more detailed discussion of High-Performance Data Warehousing (HiPerDW) – in a traditional publication! – see the TDWI Best Practices Report, titled “High-Performance Data Warehousing,” which is available in a PDF file via download.
You can also register for and replay my TDWI Webinar, where I present the findings of the TDWI report on High-Performance Data Warehousing (HiPerDW).
If you're not already, please follow me as @prussom on Twitter.
Posted by Philip Russom, Ph.D.0 comments
By Philip Russom, TDWI Research Director
[NOTE -- My new TDWI report about High-Performance Data Warehousing (HiPer DW) is finished and will be published in October. The report’s Webinar will broadcast on October 9, 2012. In the meantime, I’ll leak a few of the report’s findings in this blog series. Search Twitter for #HiPerDW to find other leaks. Enjoy!]
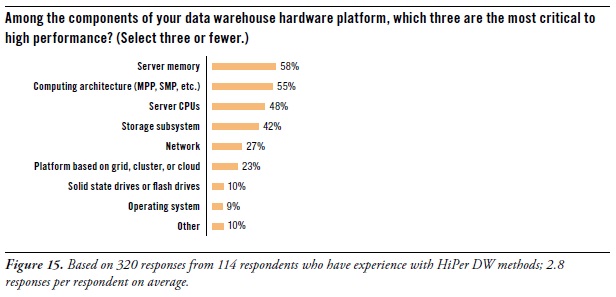
Let’s focus for a moment on the hardware components of a data warehouse platform. After all, many of the new capabilities and high performance of data warehouses come from recent advances in computer hardware of different types. To determine which hardware components contribute most to HiPer DW, the survey asked: “Among the components of your data warehouse hardware platform, which three are the most critical to high performance?” (See Figure 15. [shown above])
You may notice that the database management system (DBMS) is omitted from the list of multiple answers for this question. That’s because a DBMS is enterprise software, and this question is about hardware. However, let’s note that – in other TDWI surveys – respondents made it clear that they find the DBMS to be most critic component of a DW platform, whether for high performance, data modeling possibilities, BI/DI tool compatibility, in-database processing logic, storage strategies, or administration.
Performance priorities for hardware are server memory, computing architecture, CPUs, and storage.
Server memory topped respondents’ lists as most critical to high performance (58% of survey respondents). Since 64-bit computing arrived ten years ago, data warehouses (like other platforms in IT) have migrated away from 32-bit platform components, mostly to capitalize on the massive addressable memory spaces of 64-bit systems. As the price of server memory continues to drop, more organizations upgrade their DW servers with additional memory; 256 gigabytes seems common, although some systems are treated to a terabyte or more. To a lesser degree, users are also upgrading ETL and EBI servers. “Big memory” speeds up complex SQL, joins, and analytic model rescores due to less I/O to land data to disk.
Computing architecture (55%) also determines the level of performance. In other TDWI surveys, respondents have voiced their frustration at using symmetrical multi-processing systems (SMP), which were originally designed for operational applications and transactional servers. The DW community definitely prefers massively parallel processing (MPP) systems, which are more conducive to the large dataset processing of data warehousing.
Server CPUs (48%) are obvious contributors to HiPer DW. Moore’s Law once again takes us to a higher level of performance, this time with multi-core CPUs at reasonable prices.
We sometimes forget about storage (42%) as a platform component. Perhaps that’s because so many organizations now have central IT departments that provide storage as an ample enterprise resource, similar to how they’ve provided networks for decades. The importance of storage grows as big data grows. Luckily, storage has kept up with most of the criteria of Moore’s Law, with greater capacity, bandwidth, reliability, and capabilities, while also dropping in price. However, disk performance languished for decades (in terms of seek speeds), until the recent invention of solid-state drives, which are slowly finding their way into storage systems.
USER STORY -- Caching OLAP cubes in server memory provides high-performance drill down. “Within our enterprise BI program, we have business users who depend on OLAP-based dashboards for making daily strategic and tactical decisions,” said the senior director of BI architecture at a media firm. “To enable drill down from management dashboards into cube details, we maintain cubes in server memory, and we refresh them daily. We’ve only been doing this a few months, as part of a pilot program. The performance is good, and we received very positive feedback from the users. So it looks like we’ll do this for other dashboards in the future. To prepare for that eventuality, we just upgraded the memory in our enterprise BI servers.”
On a related topic, one of the experts interviewed for this report had this to add: “As memory chip density increases, the price comes down. Price alone keeps most server memory down to one terabyte or less today. But multi-terabyte server memory will be common in a few years.”
Want more? Register for my HiPer DW Webinar, coming up Oct.9 noon ET.
Read other blogs in this series:
Reasons for Developing HiPer DW
Opportunities for HiPer DW
The Four Dimensions of HiPer DW
Defining HiPer DW
High Performance: The Secret of Success and Survival
Posted by Philip Russom, Ph.D.0 comments
By Philip Russom, TDWI Research Director
[NOTE -- My new TDWI report about High-Performance Data Warehousing (HiPer DW) is finished and will be published in October. The report’s Webinar will broadcast on October 9, 2012. In the meantime, I’ll leak a few of the report’s findings in this blog series. Search Twitter for #HiPerDW to find other leaks. Enjoy!]
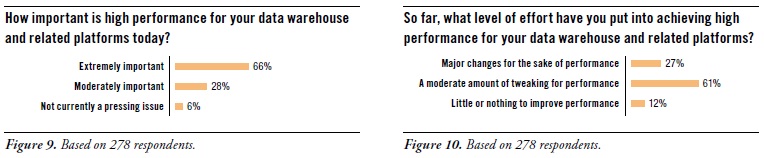
No one denies that HiPer DW is important. (See Figure 9. [shown above]) Two thirds of survey respondents called it extremely important (66%), while a quarter called it moderately important (28%). A mere 6% said that HiPer DW is not currently a pressing issue.
The wide majority of users surveyed are doing something about it. (See Figure 10. [shown above]) Luckily, most organizations can achieve their performance goals with a moderate amount of tweaking (61%). Even so, others have made major changes for the sake of performance (27%). Given that a third of user organizations are contemplating a change of platform to gain higher performance (as seen in Figure 7 [not shown in this blog]), more major changes are coming.
Whether major changes or moderate tweaking, there is a fair amount of work being done for the performance optimization of BI/DW/DI and analytic systems. To find out why, the survey asked: “Why do you need to invest time and money into performance enhancements?” (See Figure 11. [not shown in this blog])
Business needs optimal performance from systems for BI/DW/DI and analytics. This is clear from survey responses, such as: business practices demand faster and bigger BI and analytics (68%) and business strategy seeks maximum value from each system (19%). On the dark side of the issue, it’s sometimes true that [business] users’ expectations of performance are unrealistic (9%). In a similar vein, one response to “Other” said that “regulatory requirements demand timely reporting.”
Keeping pace with growth is a common reason for performance optimization. Considerable percentages of the experienced users responding to this survey question selected growth-related answers, such as scaling up to large data volumes (46%), scaling to greater analytic complexity (32%), and scaling to larger user communities with more reports (25%).
One way to keep pace with growth is to upgrade hardware. This is seen in the following responses: We keep adding more data without upgrading hardware (14%), and we keep adding users and applications without upgrading hardware (8%). Another way to put it is that adding more and heftier hardware is a tried-and-true method of optimization, though – when taken to extremes – it raises costs and dulls optimization skills.
Performance optimization occasionally compensates for tool deficiencies. Luckily, this is not too common. Very few respondents reported tool-related optimizations, such as: our BI and analytic tools are not high performance (15%), our database software is not high performance (6%), our BI and analytic tools do not take advantage of database software (4%), and our database software does not have features we need (3%). In other words, tools and platforms for BI/DW/DI and analytics perform adequately for the experienced users surveyed here. Their work in performance optimization most often targets new businesKeeping pace with growth is a common reason for performance optimization.s requirements and growing volumes of data, reports, and users – not tool and platform deficiencies.
EXPERT COMMENT -- Query optimizers do a lot of the work for us.
A database expert interviewed for this report said: “The query optimizer built into a vendor’s database management system can be a real life saver. But there’s also a lot of room for improvement. Most optimizers work best with well-written queries of modest size with predictable syntax. And that’s okay, because most queries fit that description today. However, as a wider range of people get into query-based analytics, query optimizers need to also improve poorly written queries. These can span hundreds of lines of complex SQL, with convoluted predicate structures, due to ad hoc methods, calling out to non-SQL procedures, or by mixing SQL from multiple hand-coded and tool-generated sources.”
Want more? Register for my HiPer DW Webinar, coming up Oct.9 noon ET.
Read other blogs in this series:
Opportunities for HiPer DW
The Four Dimensions of HiPer DW
Defining HiPer DW
High Performance: The Secret of Success and Survival
Posted by Philip Russom, Ph.D.0 comments
By Philip Russom, TDWI Research Director
[NOTE -- My new TDWI report about High-Performance Data Warehousing (HiPer DW) is finished and will be published in October. The report’s Webinar will broadcast on October 9, 2012. In the meantime, I’ll leak a few of the report’s findings in this blog series. Search Twitter for #HiPerDW to find other leaks. Enjoy!]
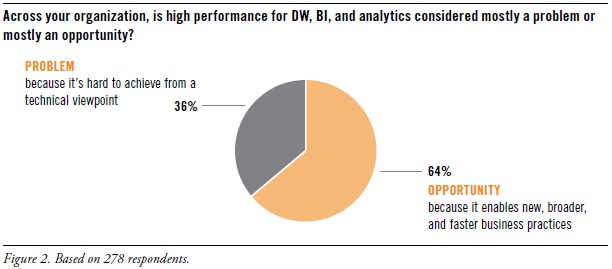
In recent years, TDWI has seen many user organizations adopt new vendor platforms and user best practices, which helped overcome some of the performance issues that dogged them for years, especial data volume scalability and real-time data movement for operational BI. With that progress in mind, a TDWI survey asked: “Across your organization, is high performance for DW, BI, and analytics considered mostly a problem or mostly an opportunity?” (See Figure 2, shown above.)
Two thirds (64%) consider high performance an opportunity. This positive assessment isn’t surprising, given the success of real-time practices like operational BI. Similarly, many user organizations have turned the corner on big data, no longer struggling to merely manage it, but instead leveraging its valuable information through exploratory or predictive analytics, to discover new facts about customers, markets, partners, costs, and operations.
Only a third (36%) consider high performance a problem. Unfortunately, some organizations still struggle to meet user expectations and service level agreements for queries, cubes, reports, and analytic workloads. Data volume alone is a show stopper for some organizations. Common performance bottlenecks center on loading large data volumes into a data warehouse, running reports that involve complex table joins, and presenting time-sensitive data to business managers.
BENEFITS OF HIGH-PERFORMANCE DATA WAREHOUSING
Analytic methods are the primary beneficiaries of high performance. Advanced analytics (mining, statistics, complex SQL; 62%) and big data for analytics (40%) top the list of practices most likely to benefit from high performance, with basic analysis (OLAP and its variants; 26%) not too far down the list. High performance is critical for analytic methods because they demand hefty system resources, they are evolving toward real-time response, and they are a rising priority for business users.
Real-time BI practices are also key beneficiaries of HiPer DW. High performance can assist practices that include a number of real-time functions, including operational business intelligence (37%), dashboards and performance management (34%), operational analytics (30%), and automated decisions for real-time processes (25%). Don’t forget: the incremental movement toward real-time operation is the most influential trend in BI today, in that it affects every layer of the BI/DW/DI and analytics technology stack, plus user practices.
System performance can contribute to business processes that rely on data or BI/DW/DI infrastructure. These include business decisions and strategies (33%), customer experience and service (21%), business performance and execution (19%), and data-driven corporate objectives (14%).
Enterprise business intelligence (EBI) needs all the performance help it can get. By definition, EBI involves thousands of users (most of them concurrent) and tens of thousands of reports (most refreshed on a 24-hour cycle). Given its size and complexity, EBI can be a performance problem. Yet, survey respondents don’t seem that concerned about EBI, with few respondents selecting EBI issues, such as standard reports (15%), supporting thousands of concurrent users (15%), and refreshing thousands of reports (12%).
Want more? Register for my HiPer DW Webinar, coming up Oct.9 noon ET.
Read other blogs in this series:
The Four Dimensions of HiPer DW
Defining HiPer DW
High Performance: The Secret of Success and Survival
Posted by Philip Russom, Ph.D.0 comments
By Philip Russom, TDWI Research Director
[NOTE -- My new TDWI report about High-Performance Data Warehousing (HiPer DW) is finished and will be published in October. The report’s Webinar will broadcast on October 9, 2013. In the meantime, I’ll leak a few of the report’s findings in this blog series. Search Twitter for #HiPerDW to find other leaks. Enjoy!]
FIGURE 1.
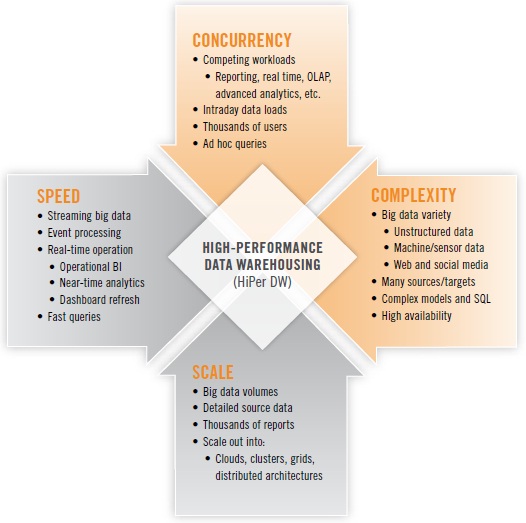
High-performance data warehousing (HiPer DW) is primarily about achieving speed and scale, while also coping with increasing complexity and concurrency. These are the four dimensions that define HiPer DW. Each dimension can be a goal unto itself; yet, the four are related. For example, scaling up may require speed, and complexity and concurrency tend to inhibit speed and scale. The four dimensions of HiPer DW are summarized in Figure 1 above.
Here follow a few examples of each:
SPEED. The now-common practice of operational BI usually involves fetching and presenting operational data (typically from ERP and CRM applications) in real time or close to it. Just as operational BI has pushed many organizations closer and closer to real-time operation, the emerging practice of operational analytics will do the same for a variety of analytic methods. Many analytic methods are based on SQL, making the speed of query response more urgent than ever. Other analytic methods are even more challenging for performance, due to iterative analytic operations for variable selection and reduction, binning, and neural net construction. Out on the leading edge, events and some forms of big data stream from Web servers, transactional systems, media feeds, robotics, and sensors; an increasing number of user organizations are now capturing and analyzing these streams, then making decisions or taking actions within minutes or hours.
SCALE. Upon hearing the term “scalability,” most of us immediately think of the burgeoning data volumes we’ve been experiencing since the 1990s. Data volumes have recently spiked in the phenomenon known as “big data,” which forces organizations to manage tens of terabytes – sometimes hundreds of terabytes, even petabytes – of detailed source data of varying types. But it’s not just data volumes and the databases that manage them. Scalability is also required of BI platforms that now support thousands of users, along with their thousands of reports that must be refreshed. Nor is it just a matter of scaling up; all kinds of platforms must scale out into ever larger grids, clusters, clouds, and other distributed architectures.
COMPLEXITY. Complexity has increased steadily with the addition of more data sources and targets, not to mention more tables, dimensions, and hierarchies within DWs. Today, complexity is accelerating, as more user organizations embrace the diversity of big data, with its unstructured data, semi-structured data, and machine data. As data’s diversity increases, so does the complexity of its management and processing. Some organizations are assuring high performance for some workloads (especially real time and advanced analytics) by deploying standalone systems for these; one of the trade-offs is that the resulting distributed DW architecture has complexity that makes it difficult to optimize the performance of processes that run across multiple platforms.
CONCURRENCY. As we scale up to more analytic applications and more BI users, an increasing number of them are concurrent—that is, using the BI/DW/DI and analytics technology stack simultaneously. In a similar trend, the average EDW now supports more database workloads – more often running concurrently – than ever before, driven up by the growth of real-time operation, event processing, advanced analytics, and multi-structured data.
Want more? Register for my HiPer DW Webinar, coming up Oct.9 noon ET.
Read other blogs in this series:
Defining HiPerDW
High Performance: The Secret of Success and Survival
0 comments
By Philip Russom, TDWI Research Director
[NOTE: The following article was published in the TDWI Trip Report of May 2012.]
The Technology Survey that TDWI circulated at the recent World Conference in Chicago asked attendees to answer a few questions about analytic database management systems and how these fit into their overall data warehouse architecture. Here’s some background information about analytic databases, plus a sampling of attendees’ responses to the survey:
A “database management system” (DBMS) is a vendor-built enterprise-class software package designed to manage databases, whereas a “database” is a collection of data managed by a DBMS. Hence, an “analytic DBMS” (ADBMS) is a vendor-built DBMS designed specifically for managing data for analytics. ADBMSs are most often optimized for “Extreme SQL,” which involves complex queries that scan terabytes of data or routines that may include thousands of lines of SQL. SQL aside, some ADBMSs support other in-database analytic processing, such as MapReduce, no-SQL parsing methods, and a variety of user-defined functions for data mining, statistical analysis, natural language processing (NLP), and so on. Some vendors package or market their ADBMSs as data warehouse appliances, columnar DBMSs, analytic accelerators, in-memory DBMSs, and cloud/SaaS-based platforms.
Half of organizations surveyed (52%) have no ADBMS. There are good reasons why some organizations don’t feel the need for a specialized analytic DBMS. (See Figure 1.) Many organizations stick close to reporting, OLAP, and performance management, for which the average enterprise data warehouse (EDW) is more than capable. Others simply haven’t matured into the use of advanced analytics, for which most ADBMSs are designed. Still others have a powerful EDW platform that can handle all data warehouse workloads, including those for advanced analytics. Among the half of respondents that do have one or more ADBMSs, most have between one and five; multiple ADBMSs can result when multiple analytic methods are in use, due to diverse business requirements for analytics. Also, analytics tends to be departmental by nature, so ADBMSs are commonly funded via departmental budgets; and multiple departments investing in analytics leads to multiple ADBMSs.
FIGURE 1. Based on 75 respondents. Approximately how many standalone ADBMS platforms has your organization deployed? 52% = Zero
37% = One to five
8% = Six to ten
3% = More than ten
Half of organizations surveyed (46%) run analytic workloads on their EDW. The EDW as a single monolithic architecture is still quite common, despite the increasing diversity of data warehouse workloads for analytics, real-time, unstructured data, and detailed source data. (See Figure 2.) Even so, a third of respondents (34%) offload diverse workloads to standalone DBMSs (often an ADBMS), typically to get workload-specific optimization or to avoid degrading the performance of the EDW. If you compare Figures 1 and 2, you see that half of respondents don’t have an ADBMS (Figure 1) because they run analytic workloads on their EDW (Figure 2).
FIGURE 2. Based on 74 respondents. Which of the following best characterizes how data warehouse workloads are distributed in your organization? 46% = One monolithic EDW that supports all workloads in a single DBMS instance
34% = One EDW, plus multiple, standalone DBMSs for secondary workloads
20% = Other
Most respondents consider an ADBMS to be a useful complement to an EDW. Even some users who don’t have an ADBMS feel this way. (See Figure 3.) According to survey results, an ADBMS provides analytic and data management capabilities that complement an EDW (56%), enables the “analytic sandboxes” that many users need (57%), and optimizes more analytic workloads than the average EDW (58%).
FIGURE 3. Based on 219 responses from 72 respondents. What are the potential benefits of complementing an EDW with an ADBMS? (Select all that apply.)
58% = Optimized for more analytic workloads than our EDW
57% = Enables the “analytic sandboxes” that many users need
56% = Provides analytic and data mgt capabilities that complement our EDW
46% = Isolates ad hoc analytic work that might degrade EDW performance
33% = Manages multi-Tb raw source data for analytics better than EDW
29% = Handles real-time data feeds for analytics better than EDW
22% = Takes analytic processing to Big Data, instead of reverse
3% = Other
Posted by Philip Russom, Ph.D.0 comments
By Philip Russom, TDWI Research Director
High performance continues to intensify as a critical success factor for user implementations in data warehousing (DW), business intelligence (BI), data integration (DI), and analytics. Users are challenged by big data volumes, new and demanding analytic workloads, growing user communities, and business requirements for real-time operation. Vendor companies have responded with many new and improved products and functions for high performance—so many that it’s hard for users to grasp them all.
In other words, just about everything we do in DW, BI, DI, and analytics has some kind of high-performance requirement. Users want quick responses to their queries, analysts need to rescore analytic models as soon as possible, and some managers want to refresh their dashboards on demand. Then there’s scalability, as in the giant data volumes of big data, growing user communities, and the overnight refresh of thousands of reports and analyses. Other performance challenges come from the increasing adoption of advanced analytics, mixed workloads, streaming data, and real-time practices such as operational BI.
Across all these examples, you can see that high-performance data warehousing (HiPerDW) is all about achieving speed and scale, despite increasing complexity and concurrency. This applies to every layer of the complex BI/DW/DI technology stack, as well as processes that unfold across multiple layers.
Luckily, today’s high-performance challenges are being addressed by numerous technical advancements in vendor tools and platforms. For example, there are now multiple high-performance platform architectures available for your data warehouse, including MPP, grids, clusters, server virtualization, clouds, and SaaS. For real-time data, databases and data integration tools are now much better at handling streaming big data, service buses, SOA, Web services, data federation, virtualization, and event processing. 64-bit computing has fueled an explosion of in-memory databases and in-memory analytic processing in user solutions; flash memory and solid-state drives will soon fuel even more innovative practices. Other performance enhancements have recently come from multi-core CPUs, appliances, columnar storage, high-availability features, MapReduce, Hadoop, and in-database analytics.
My next Best Practices Report from TDWI will help users understand new business and technology requirements for high-performance data warehousing (HiPerDW), as well as the many options and solutions available to them. Obviously, performance doesn’t result solely from the data warehouse platform, so the report will also reach out to related platforms for analytics, BI, visualization, data integration, clouds, grids, appliances, data services, Hadoop, and so on. My upcoming TDWI report (to be published in October 2012) will provide tips and strategies for prioritizing your own adoption of high-performance features.
Please help me with the research for the HiPerDW report, by taking its survey, online at:
http://svy.mk/HiPerDW. And please forward this email to anyone you feel is appropriate, especially people who have experience implementing or optimizing the high performance of systems for BI/DW/DI and analytics. If you tweet about HiPerDW, please use the Twitter hash tag #HiPerDW. Thank you!
Posted by Philip Russom, Ph.D.0 comments