I was asked recently, “What are the latest techniques for gathering business requirements?”
This is a loaded question: although there are dozens of techniques for gathering requirements, the most effective one is not to have to gather them at all. That is, your BI team has so much experience in your company and industry that it already knows what users are going to ask. And through continuous dialogue with the business--via both formal and informal channels--the team already knows the business processes and supporting data inside and out and has built much of the infrastructure needed to support current and future requirements. Beautiful.
Ok, I know, I know, I know….. Just anticipating what users want is not enough to build a solution. You still need to gather, verify, and document requirements and prototype a solution to ensure that you're building the right thing. It’s important to complement innate knowledge of the business with tried and true techniques for gathering requirements.
So that being said, here are seven of my favorite requirements gathering techniques. (And I'd love to hear your favorites!):
1. Interviews. The old standby is the one-on-one interview. And if you have good listening and synthesizing skills, there is nothing better. Send out your interview questions in advance so people can think about their answers before you get there; you’ll get better, more thoughtful responses. And make sure you ask the right questions. Don't ask, "What data do you need?" or "What do you want the report to look like?" Rather, ask: "What are you trying to accomplish?" "What actions will you take if you have this information?" "What are your goals?" "What are your incentives?" Finally, make sure you interview above and across the group you are working for as well the folks in the group itself to get the "global" perspective.
2. Joint application design (JAD) - It's best to supplement individual interviews with a group session, especially to present the findings from the individual interviews and get feedback so you can refine the requirements.
3. Surveys. Believe it or not, surveys are a great way to capture solid feedback. In an interview, most users are put on the spot (unless they dutifully prepared for the interview.) A survey gives them time to look at the questions and think about their answers before they submit them. You can also survey a lot more users than you can interview. Of course, the downside is that some people may never return the survey, in which case you need to schedule a one-on-one interview with them anyway. Always follow survey with a joint design session to get feedback from the group.
4. Process mapping. Ultimately, a BI solution is a vehicle to shed light on one or more business processes. So find out what those processes are. Understand the flow of data through each process, and how the availability of data can streamline them. Be careful though, many users are wary of process reengineering sessions where you map workflows with stickies. Asking "day in the life of…" questions might be a better approach. Ultimately, BI developers with years of experience in the business or industry already know these processes and the data that supports them.
5. Reverse engineering. You can probably obtain 60% to 80% of the metrics, attributes, and dimensions for a new report or dashboard in existing reports or operational systems. There is often no need to recreate wheel, just extend it a bit. Take the time to examine what people already use but don't let those forms bias what you produce, either.
6. Prototypes. A great way to refine your requirements is by creating a prototype based on actual data if possible (fictional data if not) so users can see and interact with a system before it goes into production. A picture is worth a thousand words. Once users "see" the application, they'll know immediately if it meets their requirements or not. Just make sure they understand it's a prototype not a production system.
7. Automation Tools. There are tools that can assist in requirements definition. Designers have long tried to snare unsuspecting users into helping them refine entity-relationship models, but these are too intimidating for most users. Some vendors, such as Kalido, use higher-level conceptual models that make it easier for developers to conduct a dialogue with users. The models can then automatically generate schema and transformation code. Another vendor, Balanced Insight, provides a tool that lets users define dimensions, attributes, and metrics in plain English and then vote on the alternatives (hence the name "Balanced Consensus"). Like Kalido, it can generate star schema and semantic layers for several leading BI tools. Other data mart automation tools in this genre include Wherescape and BI Ready.
What are your favorite techniques for gathering requirements? What gotchas lay on the road to perfect designs? I’d love to know!
Posted by Wayne Eckerson0 comments
We know the internet has transformed the encyclopedia. It’s now transforming the dictionary. For those of us who create and maintain data dictionaries, the implications are worth considering.
Wikipedia unshackled the encyclopedia from its paper-based, expert-centric, retail publishing heritage. Now anyone can contribute an entry or suggest edits and anyone with a Web browser and internet connection can use Wikipedia free of charge. This free-spirited collaborative approach to gathering and synthesizing human information has created a resource that dwarfs any traditional encyclopedia. Today, more than 85,000 active contributors have worked on 14 million articles in 260 languages.
Erin McKean, a lexicographer, is now trying to do the same for dictionaries. A former editor of New Oxford American Dictionary, McKean is co-founder of a new online dictionary called Wordnik that leverages the internet to redefine what a dictionary is and how it works.
First, McKean doesn’t believe a dictionary should be the final arbiter of words but rather a collector. To that end, Wordnik encourages people to submit new words to the online dictionary or add new definitions to existing words. Second, and most importantly for our discussion, she believes words only have real meaning in context. Therefore, her dictionary not only publishes standard definitions (from traditional dictionaries), including synonyms and antonyms, but adds a host of contextual information to make the words come to life.
Contextual Information
For instance, when you type the word “sough” (meaning a soft murmuring sound) you currently see 50 examples of how the word is used in sentences that have appeared in books or articles. You can also hear it pronounced (courtesy of American Heritage dictionary), and you can read detailed etymologies of the word’s origins. You can also see words that aren't synonyms or antonyms but show up in the same sentence and provide valuable clues about its meaning. For example, words related to sough are whiporwill, washing tub, and grooving.
Beyond soft context, Wordnik provides quantitative data. You can see a bubble chart that shows how much a word has been used every year going back to 1800 as well as statistics about punctuation applied to the word. Wordnik also links to Flikr images and Tweets that contain the word so people can see how it is being used in modern day parlance. People also can tag the word or add personal comments.
This rich contextual information turns the dictionary from a sterile arbiter of meaning to a sensuous, multidimensional, exploration of culture and history through the vehicle of words. And perhaps best of all, it gets people excited about words.
Implications
So, what is the implication for our lowly data dictionaries?
I should point out that our data dictionaries have to be precise, even moreso than traditional dictionaries where a single word like “set” can have 33 definitions. Our terms can only have one precise meaning. They are the semantic gold-standard for our organizations, the ultimate arbiter of meaning and the basis for our shared vocabulary and language.
But does that mean our data dictionaries have to be dry, static, appendages to our BI environments? Of course not. In fact, if we take a cue from McKean, we can transform the data dictionary into an active agent of organizational and cultural knowledge, which is something that’s been missing from our BI and data governance programs.
Rethinking the Data Dictionary. Think about it. When we define a data element (metric or dimension), let’s show related data elements and link to their definition pages. Let’s encourage people to rate the element and comment on what they like or don’t like about it and how it can be improved. Data owners and stewards can moderate these online discussions and track the ratings. Let’s also encourage people (both business and IT) to suggest new elements to add to the dictionary and provide definitions and contextual information.
In addition, let’s display statistics of the number of reports in which the element appears and who uses those reports the most. And then let’s link directly from the dictionary to reports or dashboards that display the element so people can see how it’s used in context. The more context we provide to the definitions and descriptions in our data dictionaries, the more useful and used they will become.
Wikis. Now you might be wondering how to incorporate all this context into a lowly data dictionary. Let’s take a cue from Wikipedia and use a wiki. In fact, many BI teams are already experimenting with wikis to collect metadata, foster collaboration, and improve communications.
Sean van der Linden of AT&T Interactive delivered a presentation last year at a TDWI BI Executive Summit in which he described Wiki templates his BI teams uses to describe/define operational data sources, business processes, data elements, and reports and showed how they could be used to facilitate requirements gathering, project management, and governance processes.
As we all know, it’s a Herculean feat to create standard definitions for key data elements. But once you do, rather than publishing static descriptions of these data building blocks, consider following McKean’s example and create an interactive metadata environment that provides rich context and a collaborative environment to enhance communication.
Tell me what you think!
Posted by Wayne Eckerson0 comments
After 15 years in the business intelligence industry, I’ve hit the mother lode: I’ve discovered the true secret to BI success. It’s really quite simple, and it’s been staring at us for years. It’s the principle of proximity.
By proximity, I mean seating your BI developers next to your business experts. Not just in a joint-application design session, a requirements interview, or scrum stand-up, but ALL THE TIME! Make them work side by side, elbow to elbow, nose to nose. It doesn’t work to merely locate them on the same campus or in the same building. You need to put them in the same cubicle block, or better yet, in one big room with no walls so everyone can see, hear, smell, and touch everyone else all the time. Radical, but effective.
And don’t mistake me: I’m not talking about business requirements analysts--I’m talking about developers who write the code and design the models. Yes, make the developers get the requirements right from the horse’s mouth. Don’t force them to learn requirements second hand through a business requirements analyst. Trust me, something always gets lost in translation.
To develop awesome BI applications, you have to function like a small start up where there are no departments or organizational boundaries, no separatejargon or incentives, no separate managers or objectives, and NO WALLS. Just one big, messy, energetic, on-the-same-wavelength family that gets things done. And fast.
Role of Agile. I like agile software development methods. They come as close as any methodology to approximating the principle of proximity. If nothing else, go agile. Create a small team of business and technical people and make them do stand-up meetings daily, if not hourly! And hold them jointly accountable for the outcome.
But as good as agile can be, proximity is better. Why? When you place developers and business experts in the same room, they almost don’t need to talk. They absorb what they need to know by osmosis, and they learn to respect what each group needs to do to succeed. And fewer meetings make happier, more productive people.
Several years ago, Wes Flores, a technology manager at Verizon, told me the secret of his group’s success: “We sit side by side with business people and report into the same leadership. The only difference is that we specialize in the data and they specialize in the business process.”
So if you want to succeed at BI, reassign your business requirements analysts and immerse your BI developers in the physical heart of the business by applying the principle of proximity.
Posted by Wayne Eckerson0 comments
It is no secret that many business intelligence jobs are getting outsourced to low-cost centers around the world. In general, these are programming tasks that don’t require direct interaction with customers: ETL programming, testing, and some report development. As offshoring increases, we have to ask, “What are the BI jobs of the future and who will fill them?”
Drive the Business. A column by Thomas L. Friedman wrote a column for the New York Times this fall (October 21, 2009) that sheds some light on the issue:
“A Washington lawyer friend recently told me about layoffs at his firm. I asked him who was getting axed. He said it was interesting: lawyers who were used to just showing up and having work handed to them were the first to go because with the bursting of the credit bubble, that flow of work isn’t there. But those who have the ability to imagine new services, new opportunities and new ways to recruit work were being retained. They are new untouchables.”
“That is the key to understanding our full education challenge today. Those who are waiting for this recession to end so someone can again hand them work could have a long wait. Those with the imagination to make themselves untouchables—to invent smarter ways to do old jobs, energy-saving ways to provide new services, new ways to attract old customers or new ways to combine existing technologies—will thrive.”
BI Imagineers. The good news for BI professionals is that it truly takes imagination to deliver an effective BI application. BI needs people who can stand between the business and technology and create solutions that anticipate user requirements for information, who help create and monitor metrics that drive performance, and help the business leverage information technology for competitive advantage.
Those individuals who can help their organizations harness technology for business gain will be in high demand and garner substantial salaries. But their knowledge can’t be gained easily—it takes years of working in the field applying technology to business problems before practical experience translates into imaginative solutions that drive the business. Imagination requires not just technical literacy—that’s just the ticket to play the game—but it takes deep knowledge of the business, its goals, strategy, people, and processes. Acquiring that knowledge takes time.
Apprenticeships Needed. I fear that if we offshore all the low-skill, entry-level BI jobs, people will never get the apprenticeships they need to become BI imagineers (to borrow a phrase from Disney.) How will people gain a foothold in the industry if there are no entry level jobs?
Jim Gallo, a consultant at Information Control Corp (ICC) in Columbus, Ohio wrote a provocative article on this topic for the BI Journal which I highly recommend. He writes, “It’s simple, really: Unless CIOs, CFOs, and CEOs make a commitment to provide opportunities to BI neophytes, we all run the risk that our BI organizations will cease to exist as strategic enablers within our own organizations.” (TDWI members can log in and read the article here.)
Gallo’s company has figured out an efficient and effective way to hire and train college graduates and make them productive members of an agile BI project team. In the article, Gallo discusses how these blended teams—which are comprised of three junior developers, a senior architect and a senior QA analyst—can compete cost-effectively against offshore BI players.
With such an apprenticeship, the junior developers on ICC’s agile teams are well on their way to becoming the BI leaders of tomorrow, garnering well-paying jobs. They are honing their technical skills by solving real customer problems under the guidance of senior BI architects and analysts. We need to make such opportunities available in our BI programs to create the imaginative leaders of tomorrow (if not today!)
Posted by Wayne Eckerson0 comments
It’s funny how we rarely eat our own dogfood. Someone recently asked a question in TDWI’s LinkedIn group about the key performance indicators that data warehousing managers should use to measure BI/DW effectiveness. The first several respondents cited classic IT metrics, such as data transfer volume, data sizes, average ETL run times, average query response times, number of reports, number of users, etc. Then, a few people reminded everyone that KPIs, by definition, are “key”—typically, few in number, driven by top-level goals, easy to understand, and actionable.
The best KPIs drive dramatic improvements to the business. As such, there may only be one or two true KPIs per function (e.g. BI/DW) per level: operational, tactical, and strategic. Typically, each set of KPIs drives performance in the level above. Thus, operational KPIs in an operational dashboard drive tactical KPIs in a tactical dashboard which drive KPIs in a strategic dashboard. Each dashboard is used by different people at different levels of the BI/DW organization--from analysts and administrators to managers and architects to directors and sponsors--but the aligned KPIs ensure that everyone is working towards the same end.
For example, an operational dashboard measures processes in flight that enable ETL analysts, BI analysts, or database administrators to fix problems as they happen and optimize performance. At this level, KPIs for BI/DW might be: “The ETL job is spitting out a large number of errors.” “Query response times are slow.” Or “The number of users on the system is below normal.” In each case, an ETL developer, database administrator, or BI analyst respectively takes immediate action to investigate and fix the source of the problem.
A tactical dashboard measures departmental objectives and goals. In the BI/DW world, these goals are specified in service level agreements established with data warehousing customers. These might include DW availability (“The DW is refreshed at 8 a.m. week days 90% of the time”) and DW reliability (The “DW is operational 99.99% of the time between 8 a.m. and 5 p.m. Eastern time.”) These KPIs show whether the BI/DW team is on track to meet SLAs in a given time period. If not, the BI manager or architect needs to figure out why and take action to meet SLAs before it's too late.
A strategic dashboard measures how well the BI/DW team is achieving its strategic objectives. Say for example, the BI/DW team’s mission is to “Empower business users with timely, reliable data that improves decisions.” A strategic KPI could be "the number of unique BI users each week who run a report," or the "ratio of active vs inactive users each week," or the "percentage of users rating BI as “critical to making quality decisions this period'” in a semi-annual survey. Lower than expected usage should cause BI directors and sponsors to understand what inhibits usability and take steps to improve it.
Sometimes, a single strategic KPI from the BI/DW team lands on the scorecard of senior executive. The executive uses the KPI to judge the effectiveness of the BI/DW resource and make funding decisions. Thus, it’s really important to think long and hard about that single KPI and how all your efforts are focused toward achieving positive results there. This can be done if your BI/DW KPIs are aligned so that lower-level KPIs drive higher-level ones and all are based on measurements that drive actions.
Let me know what you think!!
Posted by Wayne Eckerson0 comments
In a prior blog, I discussed strategies for crossing the “Chasm” in TDWI’s five-stage BI Maturity Model. The Chasm represents challenges that afflict later-stage BI programs. In my prior blog, I showed how later-stage BI programs must justify existence based on strategic value rather than cost savings efficiency, which is a hallmark of early-stage BI programs.
But perhaps a more serious challenge facing BI programs that want to cross the Chasm is migrating from a departmental BI solution to one with an enterprise scope.
Departmental Solutions. In my experience, some of the most successful BI solutions in terms of user satisfaction are developed at the department level. One reason is because the scope of the project is manageable. A department is small enough so that the technical developers might sit side by side with the business analysts and subject matter experts. They may see themselves as belonging to a single team and may even report to the same boss. The BI project is smaller and probably draws from just one or two sources that are used regularly and well known by people in the department. Moreover, hammering out semantics is straightforward: everyone uses the same language and rules to define things because they all live and work in the same “departmental bubble.”
Chasm Challenges
Politics. Conversely, developing an enterprise BI solution or migrating a successful departmental one to the enterprise level is fraught with peril. The politics alone can torpedo even the most promising applications. The departmental “owners” are afraid corporate IT will suck the lifeblood out of their project by over-architecting the solution. Corporate sponsors jockey for position to benefit from the new application but are reluctant to pony up hard dollars to lay the infrastructure for an enterprise application that benefits the entire company, not just them.
Semantics. In addition, semantics are a nightmare to resolve in an enterprise environment. What sales calls a customer is often different than how finance or marketing defines a customer. Ditto for sale, margin, and any other common term used across the enterprise. In fact, it’s always the most common terms that are the hardest to pin down when crossing departmental boundaries.
Scope. Finally, scope is an issue. Enterprise applications often try to tackle too much and get stalled in the process. The number of data sources rises, the size of the team increases, and the number of meetings, architectural reviews, and sign offs mount inexorably. The team and its processes eventually get in the way of progress. Simply, the BI program has become a bottleneck.
Hybrid Organizational Model
To cross the chasm, BI programs need to maintain the agility of departmental scale efforts with the economies of scale and integration delivered in enterprise solutions. To do this teams must adopt a hybrid organizational model, in which the central or corporate BI team manages the repository of shared data, a common semantic model, and a set of documented standards and best practices for delivering BI solutions.
Departmental IT. The corporate team then works closely with departmental IT staff responsible for developing BI solutions. The departmental developers leverage the enterprise data warehouse, common semantic model, and ETL and BI tools to create subject-specific data marts and standard reports tailored to departmental users. The corporate team oversees their development, ensuring adherence to standards where possible.
Super Users. If no IT staff exists in the department, the BI team cultivates “super users”—technically savvy business users in each department—to be their liaison or “feet on the ground” there. The corporate BI team creates subject-specific data marts and standard reports for each department using input from the Super Users. It then empowers the Super Users to create ad hoc reports around the boundaries of the standard reports but not overlapping them.
BICC. A fully-functioning BI Competency Center adopts this hybrid model where the corporate BI staff work cooperatively with departmental IT professionals and super users The glue that holds this hybrid model together are the standards and best practices that empower departmental experts to build solutions quickly that leverage the enterprise resources.
This approach ensures both agility and alignment, a rare combination seen in most BI programs. The fear of giving control back to departments and proliferating spreadmarts is why many companies are stuck in the chasm. But unless the corporate BI team cedes development work via well documented standards and practices, it becomes a bottleneck to development and causes spreadmarts to grow anyway.
Posted by Wayne Eckerson0 comments
How do you deliver dashboards that end users will adopt and use? That was the gist of the insightful and humorous presentation titled “Dashboards to Die For” delivered by John Rome, Associate Vice President in the Technology Office at Arizona State University (ASU), at TDWI’s BI Executive Summit in San Diego earlier this month.
ASU’s dashboard project started with a memo from the University’s president to the CIO, Adrian Sannier, Rome’s boss, that said “Adrian, learn all you can about Dashboards and then see me.” (See figure 1.) With a data warehouse already in place, the dashboards would be instrumental in driving usage to higher levels, making BI pervasive, according to Rome.
Figure 1.
The data warehouse already contained most of the data so ASU only needed a flexible development tool and design principles to put the icing on the cake. It chose a dashboard tool from Corda Technologies which enabled it to create dashboards quickly by pulling data from any system, including the data warehouse. It then consulted a few dashboard and design experts, including Edward Tufte, Stephen Few, and yours truly.
Four years later, ASU has deployed dozens of dashboards in multiple departments and now has its own tips and techniques for delivering user-friendly and powerful dashboards. Here are a few of John’s recommendations:
<!--[if !supportLists]-->
- Embed dashboards as a link within the corporate portal so users have one click access to the information
- The best screen size for the dashboard window is 1024 x 768
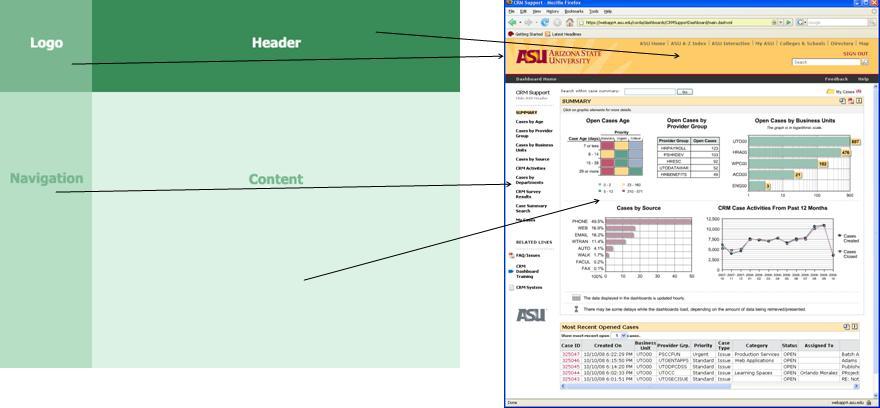
- Place the most important elements for viewing in the upper left hand corner and the least important in the lower right corner to mimic the way the eye scans a page.
- Avoid decorative dashboard elements, like dials, gauges, and images and cluttering the screen with images and color.
- Design your dashboard pages to mimic popular Web layouts.
- Create a summary screen of the most important information. (See figure 2.)
Figure 2.
- Place elements on the screen so users don’t have to scroll.
- Add a “design tip” logo that users can click to get techniques about using the displayed elements and offer an online help center that provides a directory of topics for using the dashboards.
- Avoid pie charts, 3-D elements, and gradient shading.
- Accommodate color blindness.
- Accent key variables with subtle hues or patterns. See figure 3.
Figure 3. From
The Dashboard Spy. 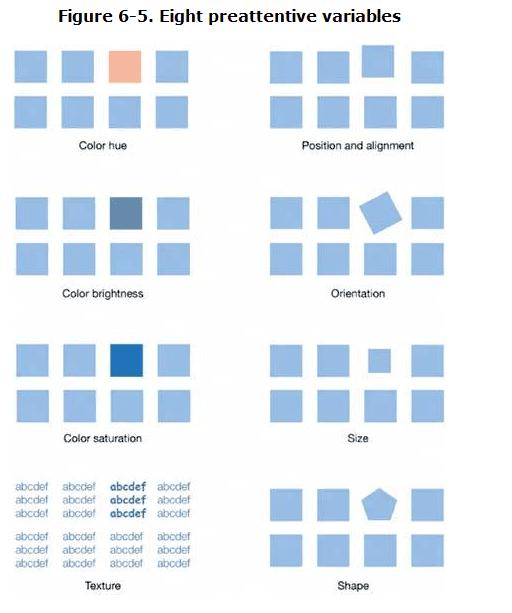
- My favorite: “Power comes with interaction/drills.”
- Make dashboards actionable. Here ASU has bidirectionally linked its dashboards to various operational systems, such as its PeopleSoft HR system, so authorized users can update the status of employees, classes, students, professors, etc.
- Use non-serif fonts and 12 point text for the main body and smaller fonts for supplementary text.
- Provide metadata about metrics, including SQL used. Offering screen cams and FAQs also helps.
- Use ranking to help users assess key elements within the data and to promote friendly competition among peer groups.
- Use charts rather than tables.
- Abbreviate numbers appropriately, so that $13,002,000 is $13M
- Perform usability studies to understand how users interact with the dashboard.
- Customize the dashboards by role.
Of all the design tips, the most powerful are to make the dashboards drillable, actionable, and instantly informative. ASU has put a lot of time and thought into the design and delivery of its dashboards and the effort has paid off. But don’t just take my word for it; check out ASU’s public dashboard Web site where you can get more information about the dashboards used at the University: http://dashboard.asu.edu.
Posted by Wayne Eckerson0 comments
More than 70 business intelligence directors and sponsors gathered in San Diego this week for the TDWI’s semi-annual BI Executive Summit. The executives were enlightened by a mix of case studies (NetApp, Dell, Arizona State University, RBC Wealth Management, and ShareThis) and educational sessions on key areas of interest (BI in the Cloud, change management, cost estimating BI projects, Hadoop, visualization, BI mashups, social intelligence, pervasive BI, and the future of BI.)
The attendees also voted on technologies and programs that will be of key interest to them in the next three years. Topping the technology chart were predictive and in-database analytics, dashboards, visualization, the cloud, and operational BI. On the process side, key initiatives will be data quality and governance, business process management, and BI competency centers.
The event’s sponsors also chimed in during sessions and the future of BI panel. Teradata discussed active data warehousing, Information Builders showed how to integrate strategic, tactical, and operational BI, Birst discussed the benefits of cloud-based computing via its customer RBC Wealth, Sybase discussed in-database analytics via SQL-based plug-ins from Fuzzy Logix, and IBM discussed innovations in BI, such as search, collaboration, and mashups.
Most attendees valued the networking and collaboration that the event offers during lunch and breaks. In addition, hands-on workshops put the attendees in the drivers seat. During the Dell case study, attendees were given a real-life scenario of Dell’s data warehousing environment circa 2007 and then in groups had to decide how they would have approached the issues that Dell faced. After considerable discussion and debate, representatives from Dell—who were actively taking notes during the discussion phase—told the audience how they approached the situation. The workshop on change management also asked the attendees to work in small groups to discuss the implications of the FEE (fear, entitlement, earning.)
Quotable Quotes from the event:
- “You typically only need 12 metrics to run a company.” Tony Politano, consultant and author of Chief Performance Officer
- “Our dashboards, which are all built on the same platform and enterprise model, provide enterprise, functional, and role based views of information.” Dongyan Wang, NetApp
- “We designed the dashboard so that any user could get any information they want at any level of detail in three clicks.” Dongyan Wang, NetApp
- “A dashboard should provide more than composite views of information; they should allow users to create a personalized mashup via Web services and widgets so the environment caters to their needs.” Laura Edell Gibbons
- “Add a top 10 list to your portal to enhance usage and pay attention to principles of visual design.” John Rome, Arizona State University
- “We inventoried our spreadmarts and found we had about 40,000 around the world and that didn’t even count spreadsheets.” Rob Schmidt, Dell
- “It’s important to pick data governance decision makers at the right level; we had Michael Dell’s direct reports.” Mike Lampa, Dell
- “The initial response of the business units to the decision to shift analysts who spent most of their time creating reports into IT was ‘Go to hell!’ But quickly, the saw that the move would free up budget dollars and headcount for them and they bought into the decision.” Mike Lampa, Dell
- “One lesson learned [during the Dell DW renovation] was losing sight of the importance of delivering value while establishing and enforcing enterprise standards.” James Franklin, Dell
- “Our BI architectures are rooted in outdated assumptions of resource scarcity.” Mark Madsen, Third Nature
- “Because of advances in processing and storage power, we could now ship the data warehouse that I built in 1993 for $1.5 million on a laptop to every individual in the company.” Mark Madsen, Third Nature
Posted by Wayne Eckerson0 comments
I recently reviewed the course materials for a class titled “A Step by Step Guide to Enterprise Data Governance” taught by Mike Ferguson at the TDWI Munich conference in June. Mike did a tremendous job covering the full scope of the data governance topic.
Mike defines enterprise data governance as “the set of processes by which structured and unstructured data assets are formally managed and protected by people and technology to guarantee commonly understood trusted and secure data throughout the enterprise.”
The elements that Mike puts in the data governance bucket are: data definitions and shared business vocabulary; metadata management; data modeling, data quality; data integration; master data management; data security; content management; and taxonomy design and maintenance.
This is a big vision, and certainly elevates the discussion to its proper perspective: that is, data is a business asset and it’s the responsibility of business to oversee and manage this resource. The corollary here is that IT plays a supporting, not supervisory, role in managing the company’s data.
Central to Mike’s vision of enterprise data governance is a Change Control Board, which is the “gatekeeper” for the shared business vocabulary. This board, which is comprised of data stewards from the business, is responsible for approving requests to change, add, or decommission data items. Implicit in this is that the Change Control Board manages data names and definitions, transformation rules, and data quality rules. And these get baked into data models, BI metadata, MDM models, and taxonomies.
Given how fundamental data is to a business (whether it knows it or not), it’s imperative that a senior executive oversee the data governance team that is comprised of senior business managers and stewards. Maria Villar, owner of MCV LLC, writes, “A business data steward is a leadership position…. who understands the importance of data to their part of the business.” (See “Establishing Effective Business Data Stewards” in the spring 2009 edition of the BI Journal.)
Villar says a business data steward “understands the priorities and strategies of the business unit, commands respect within the organization, builds consensus across a varied set of business priorities; influences and drives changes to business processes, enjoys strong support from senior business leaders, can communicate to business and technical teams, and builds a diverse team of technical and business data experts.
Now that we have the verbiage straight, we have to execute on the vision. And that will keep us busy for years to come!
Posted by Wayne Eckerson0 comments
Let’s face it. Most of our BI programs could use a little boost. Despite our best intentions, our BI programs aren’t getting the traction we (or our sponsors) anticipated. Performance is too slow or the data is suspect or we didn’t deliver exactly what users wanted. Or maybe, after years of disappointment, bungled communications, or cost overruns, the business simply doesn’t trust IT to do anything right.
If this describes your situation, it’s time for a quick win. You’re stuck in a perpetual negatively reinforcing loop and you need something dramatic—but quick and cheap—to get you and your team out of its rut. You need to do something that will bring a smile to their face and make them see you as an ally who can solve their problems. If your quick win succeeds, the business will shower you with money to fund more projects, including extensions to your data warehouse.
Of course, there is a catch. A quick win usually requires you to work outside of established platforms, processes, and procedures. While those things ensure that IT delivers stable, scalable solutions, they often impede quick action. A quick win often requires you to build something outside the existing architecture (especially if your existing data warehouse isn’t properly designed or supported.) As such, you need enough seniority or clout to bend the rules and make things happen.
This week I talked with a veteran BI director at a company who inherited a stalled data warehouse and a culture of distrust between business and IT. To gain credibility for the BI program and bridge the business-IT gulf, he sought a quick win. To scope his project, he met informally with business managers and executives to discuss their frustrations and needs. (As a former accountant he could “talk the talk” of business which helped immensely.) He learned that the company suffered from the “dueling spreadsheet” syndrome where executives from different departments couldn’t agree on basic sales numbers because they defined “product” differently. He got approval for a project that would track three “product” metrics through product development and launch. (Phase two will track product performance after launch.)
The project took six months from start to finish for approximately $75,000 (although this company doesn’t track costs for internally used resources. The solution enabled the company’s top executives for the first time to monitor a process that cut across departmental boundaries using standardized metrics. Needless to say, the solution was a big success and garnered the BI team much needed credibility. The caveat here is that he did not build the application on top of the existing data warehousing platform which has stringent change control processes which would have delayed deployment and increased costs. But with this quick win under his belt, the manager is now securing support and funding to overhaul the data warehouse. Eventually, he will retrofit the quick win application to run within the data warehousing environment.
The moral of the story is that a quick win can help build goodwill with the business and galvanize support that is needed to turn around a sagging data warehousing initiative. But to achieve a quick win, you often have to break the rules and work outside of standard architectures, processes, and procedures. If you are willing to take a risk, the rewards can be significant.
Posted by Wayne Eckerson0 comments