This is my last blog as an employee of TDWI. As of November 15th, I’ll be doing research, consulting, and speaking at a different media company, and my Wayne’s World blog will come with me. In addition, I will have my own consulting company—BI Leader Consulting—to do advisory work and assessments for user organizations. I will miss TDWI dearly.
Early Days at PSG
I am fortunate to have started covering data warehousing as it exploded on the scene in the early 1990s. At the time, I was a neophyte research consultant at the Patricia Seybold Group (PSG) in Boston, covering message-oriented middleware. With data warehousing, I found a kindred spirit—I quickly saw that data warehousing was a technology-centric approach to help people and organizations analyze, plan, act, and learn. As a former teacher and journalist, it was a match made in heaven.
I wrote my first report on data warehousing in 1995. I remember hunkering down with Michael Saylor and Sanju Bansal of MicroStrategy, who patiently explained to me the architecture behind their new desktop ROLAP tool. The report hit a nerve in PSG’s audience. So, in short order, I wrote reports on ETL engines (1996), DW databases (1996), OLAP (1996), Web-based query tools (1997), and CRM (1997). As I skim through these reports now, I realize that a lot has changed since then, but much has stayed the same.
During my tenure at PSG, I defined the term “dependent data mart” which became part of the BI lexicon. Later, I coined the term “spreadmart” and more recently “mashboard.” (An industry analyst gauges his self-worth by the number of industry standard terms credited to him ;-) Of course, I had some missteps: I called ETL engines “data conversion engines” and I thought the “information mall” was a surefire hit until the term “portal” came along and went mainstream.
The Origins and Evolution of TDWI
Alan’s Vision. Meanwhile, I attended the first TDWI conference in the spring of 1995 in Washington, D.C. TDWI was founded by Alan Paller, a serial software entrepreneur who detested industry tradeshows and wanted to bring a degree of academic rigor to conference education. Alan was working at Computer Associates at the time, having recently sold his graphics company to CA, so he hired Ramon Barquin, a long-time D.C. consultant, to be TDWI’s first president and titular leader.
Those early conferences were jam packed. TDWI’s biggest event was in 1997 at a run-down, two-story hotel on the outskirts of San Diego near the baseball stadium which more than 1,200 people attended. For me, a fresh-faced BI wannabe, those events laid the foundation for my knowledge of data warehousing and business intelligence and later career at TDWI.
Gurus. I’m forever indebted to the early gurus who taught at TDWI and effectively pioneered the domain. They include Ralph Kimball, Bill Inmon, J.D. Welch, Doug Hackney, Herb Edelstein, Barry Devlin, Margie Ross, Michael Haisten, Hugh Watson, Laura Reeves, David Marco, Pieter Mimno, Warren Thornthwaite, Karolyn Duncan, Jeff Gentry, and Jim Thomann. More recently, the educational torch has passed to a new generation of leading lights, who are taking BI to the next level. These include Jill Dyche, Evan Levy, Claudia Imhoff, Jon Geiger, Stephen Brobst, Maureen Clarry, Sid Adelman, Mike Gonzales, Richard Hackathorn, Colin White, Steve Hoberman, Cindi Howson, Steve Dine, David Loshin, Barbara Wixom, John O’Brien, Ralph Hughes and many others. (I didn’t realize that list would be so long, and I've only scratched the surface!)
The Early Team. In 1997, I met Steven Crofts, who had just purchased TDWI from Alan Paller, who sold the company because of a family illness, and he was afraid that DCI (a competing events company) would kill TDWI in the marketplace. (Actually, the reverse happened.) Paller went on to form SANS Institute, a training company that focuses on information and computer security, which he modeled after TDWI but which is now two or three times the size.
Meanwhile, Steven Crofts became TDWI’s new president and he brought with him two seasoned marketing professionals, Richard Rist, and Ellen Hobbs. I hit it off with this new executive team, and before long, I was co-teaching classes at TDWI with Rich, spreading the gospel of BI tools and best practices.
BI Directors. At TDWI conferences, I started meeting some very talented BI directors, to whom I’m forever indebted for the knowledge they imparted about the nuances of creating successful data warehousing and BI solutions. During a break in one class, I remember coaxing Mike Masciandaro, director of BI for Rohm and Haas (now Dow Chemical), to explain to the class how he was using an Excel “helper app” to connect his Excel jockeys to the data warehouse. We’ve been friends ever since, and I’ve watched with admiration as he has built one of the most effective BI programs in the industry.
Mike is just one of the BI veterans I’ve had the pleasure to meet and learn from over the years. I’ve invited many of these leaders to participate in a TDWI Think Tank (which I’ll have to reincarnate somehow), which includes people from across a range of industries. They include Andrea Ballinger (Illinois State University), Darrell Piatt (CSC), Jim Keene (Harley Davidson), Jim Rappé (Navistar), Jim Gallo (Worthington Industries/CCI), Matthew Schwartz (PetSmart), Ken Rudin (Zynga), Eric Colson (Netflix), M.C. Sankar (Wachovia), Matthew March (Carrington Mortgage), Tim Leonard (USXpress), Mike Lampa (Dell), Jim Hill (1800 Contacts), Christopher Jones (Adobe) Bill Baker (formerly Microsoft), Dan Evans (Avanade), John Rome (Arizona State University), Brian True (Intuit), Carey Moretti (Amylin), Jason Beard (Wiley) and the list goes on….
The Modern Era
I finally joined TDWI in 1998 as director of research services, working with Crofts, Hobbs, and Rist, and I was happy as a clam. However, during the turmoil leading up to TDWI’s acquisition by 101communications in 2000, I left the company. Unfortunately, I was unconsolably homesick for TDWI (just ask my wife). When Ellen Hobbs, the new TDWI general manager, called just after the deal closed to invite me to become TDWI’s director of education, I was ecstatic. It felt terrific to return home.
With belief in TDWI’s potential and a vision for its future, I reinvigorated TDWI’s curriculum and introduced many new products, including night school, hands-on labs, trip reports, executive summits, and research reports. As the research expanded, my position became too big for one person, and we split the job in two. We invited Dave Wells, a consummate trainer and course developer who had been building TDWI’s curriculum, to join as full-time director of education, and I became director of the newly minted TDWI Research.
TDWI Research. Since 2002, starting with a landmark report on data quality, TDWI Research has published more than 30 Best Practice reports, ranging from pervasive BI to master data management. We’ve run more than a dozen executive summits, delivered more than 200 Webcasts, and written innumerable articles and blogs. Phew! I leave TDWI Research in the very capable hands of my colleague, Philip Russom, whom I am confident will hire someone better than me so TDWI can continue to shine brightly as a thought leader in the industry.
The Team
As with any journey, it’s the people that make all the difference. One reason TDWI has a strong brand and high customer loyalty is the people who work there. TDWI is very lucky to have people like Paul Kautza, Brenda Woodbridge, Maria Matthews, Diane Foultz, and Marie Gipson on the conference team and Denelle Hanlon, Yvonne Baho, Steve Cissell, Tina Hansen, Heather Flynn, and Scott Geisler in sales. They are also fortunate to have Jennifer Agee, Deirdre Hoffman, Bill Grimmer, and Roxanne Cooke in production and design and Melissa Parrish, Lesley Nadarski, Seth Birnbaum, Jayson DeMers, and John Bardell in marketing and Web design.
In addition, many people have contributed significantly to TDWI over the years who are no longer there but whose impact is still being felt. I’m thinking of talented staffers like Meighan Berberich, Michelle Johnson, Eric Kavanagh, Sandy Prescott, Margaret Ikeda, Jen Noland, Judy Harbaugh, Diane Allard, Matt Smith, and Jennifer Hay, to name just a few.
Highs and Lows. These past and present troopers have weathered the good, the bad, and the ugly. For example, in 2006, 101communications, TDWI’s parent company, was purchased by another venture-backed rollup, called 1105 Media, and we got a new general manager, Rich Zbylut. After a brutal, internal, corporate-led restructuring, the economy tanked and our attendees cut training and travel expenses to zero. This created a huge challenge for the team, and 2009 was certainly a lean year. But thanks to Rich’s leadership and the fighting spirit of TDWI’s staff, the company had its most profitable year ever. Go figure!
Goodbye!
So, TDWI, it’s been a great ride. I thank you for the opportunity that you’ve given me to teach and educate BI professionals worldwide, and, more importantly, for being good coworkers and even better friends. And, I am deeply grateful for allowing me to be at the epicenter of the data warehousing and business intelligence industry for the past 15 years. I wish you the best!
0 comments
The Teradata Partners User Conference is one of the largest dedicated data warehousing conferences, pulling BI professionals from all over the world. Its attendees are collectively the most sophisticated users of BI anywhere. Given that Teradata is reinvigorated since the spinoff from NCR and more nimble and responsive, this is a good fit. Here are highlights of what I learned in my brief (1 day) visit to Partners.
Teradata Appliances
Teradata is having good success selling the 2650 machine, which customers are using primarily for departmental warehouses and dependent data marts. Customers like the product because unlike some competitors (e.g. Netezza), the box is easily expandable and highly scalable. You buy only the nodes you need, and if you reach the capacity of the box, you simply buy another, connect it with the first via gigabyte Ethernet, and redistribute the data. With other appliances, you need a forklift upgrade. (Although a Netezza customer said this wasn’t a major inconvenience.) The only downside to the 2650 appliance is that many people still don’t know that it exists. And Teradata, which always priced its products at a premium, recently lowered the list price on the 2650, making it competitively affordable.
Solid State
I also had a chance to bump into the always pleasant and insightful Dan Graham, who was recently promoted to general manager of enterprise systems at Teradata Labs. Congrats Dan! In his new role, he is spending a lot of time thinking about how to integrate solid state disk into Teradata’s big iron. He said it’s a big challenge to do it right and he’s determined to make Teradata a leader in dynamic allocation of data to solid state drives. He also said solid state also has thorny implications for pricing.
Hadoop
I also had fun talking with Dan two weeks ago at Hadoop World where he was nonplussed about comments made by some of the more exuberant voices in the Hadoop and NoSQL community about how Hadoop will displace relational databases. A recent Tweet of his sums it up: “It’s Hadoop 1.ohmygod.” Seriously, as a distributed file system, Hadoop in its current and near future states won’t offer the analytical interactivity of a relational database. The two are complementary, not competitive—at least for the foreseeable future.
Viz Contenders
Tableau. Visualization vendor Tableau had a sizable booth at Partners, reflecting its rising star status. Tableau is a Windows desktop tool that is easy to install, easy to use, and affordable (less than $1,000 for a single user). It makes it easy for users to explore data visually and publish live views to a server environment ($10,000+) for others to consume. It works well with new analytic appliances because it queries remote databases, and its recently added in-memory database can cache frequently used data sets to improve performance.
BIS2. Also exhibiting was BIS2, an up-and-coming visualization vendor, that takes a different approach to the graphical display quantitative information than Tableau. BIS2 is a server-based environment that generates complex SQL against large, complex relational databases to render what it calls “super graphics.” These are rich, multi-layered visualizations often displayed as heatmaps. Unlike the desktop-oriented Tableau, BIS2 is an enterprise visualization platform that can be embedded in other applications. Today, most of the world’s airlines use BIS2.
Managed Excel
I bumped into Donald Farmer of Microsoft, Suzanne Hoffman of Simba, and Sam Tawfik of Teradata within about 30 minutes of each other, and they all had the same message: Excel now runs directly against major databases without a mid-tier. Microsoft’s PowerPivot queries remote data sources to populate a scalable, local column store, whereas Teradata’s newly launched and misnamed Teradata OLAP enables Excel to query Teradata using MDX running against Aggregate Join Indexes (a virtual cube.) Bravo Teradata for getting out in front of the new charge to make Excel a managed BI environment. Of course, other vendors have already jumped on that bandwagon, including, including Lyzasoft, Quest (Toad), and startup Bonavista Systems (which makes Excel look like Tableau.) Others that will soon join the parade are SAP with its BEx replacement called Pioneer and IBM Cognos with desktop product in the labs.
Farmer spooked me a bit when he said one customer in Europe has deployed 100,000 copies of PowerPivot. I’ve assumed PowerPivot would be sparsely deployed since it’s an Excel add-in designed for hard core data jockeys. But Microsoft thinks otherwise: Donald reminded me that PowerPivot is free and that it will soon be included in trial versions of Microsoft Office to improve the product’s visibility outside of BI professionals, who are the product’s biggest champions currently. When I voiced concern about spreadmart proliferation among PowerPivot users, he said the big gating factor is the 10MB limit for attachments imposed by most email servers. Whew! He also said Microsoft is trying to make SharePoint so attractive as a collaboration platform that it becomes the preferred method for sharing PowerPivot data. We’ll see!
Mobile
MicroStrategy. I talked briefly with MicroStrategy’s lead man, Sanju Bansal on the show floor, and attended the company’s Tuesday evening session on mobile BI. I told Sanju that I admired MicroStrategy’s “make or break” bet on mobile BI, and its first mover advantage. I added that if the bet succeeds, MicroStrategy could be a very different company in five years, selling information-driven apps and development platforms into a consumer market. Sanju corrected some of my conjectures. He said the bet on mobile was a “make” play only and the target market for its mobile products will be business customers, not consumers.
MicroStrategy, like Teradata, has been pigeonholed at the high-end of the BI market for a long time, generating much of its revenues from its installed base. To continue to grow and exert influence over the industry, it needs to make a legitimate play for the “low end” where there are more customers. MicroStrategy estimates that there are 5 billion mobile users. That’s pretty big low-end market to play in and is a contributing factor to its aggressive push into the mobile arena.
Mobile Visualization. What’s great about mobile BI is that the limited screen real estate forces developers to adhere to key visualization principles, like “less is more.” Mark LaRow of Microstrategy told me a few months ago that mobile BI apps are more usable than their Web counterparts because they are purpose-built and highly focused. They are designed to enable a single function, and as a result, mobile applications are much more intuitive to use than general-purpose BI applications that are overloaded with functionality. Sometimes strait jackets bring enlightenment.
0 comments
IBM Cognos this week released Cognos 10, a major new release of its business intelligence software that contains lots of new goodies that are sure to bring smiles to its installed base and tempt some SAP BusinessObjects customers to jump ship.
I spent two days in Ottawa in September getting the IBM and Cognos 10 pitch. Here are highlights:
Company
- Strategy. Analytics is key to IBM’s future growth, which means Cognos is the apple of IBM's eye. IBM has spent $14 billion acquiring 25 companies since 2006 (inicluding $5M for Cognos) and there is no sign its buying spree will end soon.
- Services. IBM’s newly created Business Analytics Optimization services arm earned $9.4 billion last year, and IBM is hiring consultants like crazy to keep up with forecasted demand. Its target is 8,000 consultants worldwide.
- Licenses. Cognos 8 had double digit license growth the past five quarters, while the newly launched mid-market product, Cognos Express, which runs on the in-memory database TM1, has hundreds of customers in 25 countries. And TM1 is hot, generating double digit growth on its own during the past year
Cognos 10
- Visual Integration. Whereas Cognos 8 integrated the underlying architecture of Cognos’ once distinct products (reports, query, OLAP, dashboards, planning), Cognos 10 integrates the user experience. The new BI Workspace blurs the visual boundaries between these capabilities so users can seamlessly traverse from reporting to analysis to dashboards to planning and back again.
- Mashboards. Cognos 10 lets users create their own workspaces from widgets consisting of predefined report components. In other words, a mashboard. Report developers (using Report Studio Professional) simply “widgetize” charts, metrics, and even entire reports and they are automatically added to a library that users can access when creating their own personal workspaces.
- Progressive Interaction. Cognos 10 will expose additional functionality as users need it. For example, Business Insight users can click a button that says “do more” to expose functionality from Business Insight Advanced (replaces Report Studio Professional) to add objects and dimensions not available in the Business Insight library.
- Annotation. Users can annotate at the workspace, widget, or cell level (i.e., within a grid).
- Personal data. Users can add personal data from Excel and Cognos 10 will track, audit, and secure the data. I haven’t seen this demo’d yet, so I’m eager to see how it works.
- Active Reports. Cognos 10 lets report developers create interactive, Web-based reports, burst tailored versions to thousands of users who can interact with them offline. Information Builders coined the term Active Reports for much the same technology, so IBM Cognos should be careful about infringing trademarks here.
- Improved Query Performance. Cognos 10 has improved query performance by automatically generating optimized SQL or MDX depending on the source and implementing a dimensionally-aware, secure shared cache that can cache queries, metadata, members, and tuples.
- Lifecycle Manager – This lets administrators compare versions of reports visually to validate the efficacy of software upgrades and migrations from development to test to production. This is a very useful feature.
There’s a lot to like in Cognos 10 and it should give IBM Cognos a long-lasting stream of new and upgraded license revenue.
0 comments

To succeed with business intelligence (BI), sometimes you have to buck tradition, especially if you work at a fast-paced company in a volatile industry.
And that’s what Eric Colson did when he took the helm of Neflix’ BI team last year. He quickly discovered that his team of BI specialists moved too slowly to successfully meet business needs. “Coordination costs [among our BI specialists] were killing us,” says Colson.
Subsequently, Colson introduced the notion of a “spanner”—a BI developer who builds an entire BI solution singlehandedly. The person “spans” all BI domains, from gathering requirements to sourcing, profiling, and modeling data to ETL and report development to metadata management and Q&A testing.
Colson claims that one spanner works much faster and more effectively than a team of specialists. They work faster because they don’t have to wait for other people or teams to complete tasks or spend time in meetings coordinating development. They work more effectively because they are not biased to any one layer of the BI stack and thus embed rules where most appropriate. “A traditional BI team often makes changes in the wrong layer because no one sees the big picture,” Colson says.
Also, since spanners aren’t bound by a written contract (i.e., requirements document) created by someone else, they are free to make course corrections as they go along and “discover” the optimal solution as it unfolds. This degree of autonomy also means that spanners have higher job satisfaction and are more dedicated and accountable. One final benefit: there’s no fingerpointing, if something fails.
Not For Everyone
Of course, there are downsides to spanning. First, not every developer is capable of spanning. Some don’t have the skills, and others don’t have the interest. “We have lost some people,” admits Colson. Finding the right people isn’t easy, and you must pay a premium in salary to attract and retain them. Plus, software license costs increase because each spanner needs a full license to each BI tool in your stack.
Second, not every company is well suited spanners. Many companies won’t allocate enough money to attract and retain spanners. And mature companies in regulated or risk-averse industries may work better with a traditional BI organization and development approach.
Simplicity
Nonethless, experience shows that the simplest solution is often the best one. In that regard, spanners could be the wave of the future.
Colson says that using spanners eliminates much of the complexity of running BI programs and development projects. The only thing you need is a unifying data model and BI platform and a set of common principles, such as “avoid putting logic in code” or “account ID is a fundamental unifier.” The rest falls into the hands of the spanners who rely on their skills, experience, and judgment to create robust local applications within an enterprise architecture. Thus, with spanners, you no longer need business requirement analysts or requirements documents, a BI methodology, project managers , and a QA team, says Colson.
This is certainly pretty radical stuff, but Colson has proven that thinking and acting outside the box works, at least at Neflix. Perhaps it’s time you consider following suit!
0 comments

I transcended time and space earlier this week when I attended Hadoop World in New York City.
It started Monday evening. After taking a high-speed train from Boston, I emerged from the bowels of Penn Station onto the bright lights and bustling streets of mid-town Manhattan. The pavement was wet from a passing rain and lightening pulsed in the distant sky, framed by the city’s cavernous skyscrapers. I felt like I had entered a Hollywood set for an apocalyptic movie. But that was just the beginning.
Invigorated by the city’s pulsing energy, I decided to walk 15 blocks to my hotel. Halfway there, the winds picked up, the muted lightening roared to life, and rain scoured the streets in endless waves. I ducked under a large hotel canopy just in time to see hail the size of shooter marbles pelt everything in sight. After 15 minutes, the deluge subsided. But by the time I reached my hotel, I was soggy and stunned.
Welcome Aboard!
The next morning, as I listened to the proceedings from Hadoop World, I realized that the prior night’s surreal weather was a fitting prelude to the conference—at least for me. Hadoop World was a confab for programmers—almost 1,000 of them. As a data guy, it felt like I had been transported to parallel universe where the people looked and acted the same but spoke a completely different language. But what I did understand, I liked.
With Hadoop, it seems that the application community finally discovered data and its potential to make businesses smarter. “Hadoop is a high value analytics engine for today’s businesses,” said Mike Olson, during his kickoff keynote. Mike is CEO and Founder of Cloudera, an open source provider of Hadoop software and services and host of the event. Following Olson on the stage was Tim O’Reilly, founder of O’Reilly Media, a long-time high-tech luminary and open source proponent. He said, "We are the beginning of an amazing world of data-driven applications. It's up to us to shape the world."
It was wonderful to see the developer community discover data in all its glory. To my fellow developers, I say, “Welcome aboard!” We’re all on the same page now.
Fathoming Hadoop
Hadoop is one of the first attempts by the developer community to get their arms around data in a way that conforms to their skills, knowledge, and culture. From a data guy’s perspective, Hadoop is clunky, slow, and woefully immature. But it does have advantages. As a result, it’s already popping up in corporate data environments as a complement to analytical databases. For example, some leading-edge companies are using Hadoop to process and store large volumes of clickstream and sensor data that they then feed into analytical databases for query processing.
So what is Hadoop? It might be easier to say what it's not.
· Hadoop is not a database; it’s a distributed file system (Hadoop Distributed File System or HDFS) that scales linearly across commodity servers. It is also a programming model (MapReduce) that enables developers to build applications in virtually any language they want and run them in parallel across large clusters.
· Hadoop is not a transactional system; it’s a batch-oriented system that runs hand-crafted Map-Reduce programs. You are not going to run iterative queries in Hadoop.
· Hadoop does not support random data access; it reads and writes all data sequentially, which makes it tortuously slow for tactical updates and queries and mixed workload applications.
Today, Hadoop shines as an infinitely scalable data processing environment for handling huge volumes of data that would be prohibitively expensive to store and analyze in a traditional relational database or even a data warehousing appliance. Hadoop lets companies capture and store all their data—structured, semi-structured, and unstructured—without having to archive or summarize the data. Consequently, some companies, such as Comscore and CBS Interactive, use Hadoop as a massive staging area to capture, store, and prepare large volumes of data for delivery to downstream analytic structures.
The main advantages of Hadoop are:
1. Open Source. The software is free. And free is good compared to spending millions of dollars on a relational database to handle tens of terabytes to petabytes of data (if it can.) You can download individual components from the Apache Software Foundation, or purchase a “distribution” from third party providers, such as Cloudera or IBM. A distribution is a package of Hadoop-related applications that are tested to ensure compatibility and stability and delivered with support and professional services on a subscription basis.
2. Linear Scalability. Hadoop is an MPP system that runs on commodity servers. It scales linearly as you add more servers. It has minimal overhead compared to relational databases so it offers superior scalability.
3. Streaming. Hadoop is a file system that does not require specialized schema or normalization to capture and store data or a special language to access it. Therefore, Hadoop makes it possible to perform (high-speed) reads and writes. In addition, a new application called Flume lets Hadoop consume streaming event data. In other words, it’s easy to get large volumes of data in and out of Hadoop.
4. Unstructured data. Because of its schema-less design, Hadoop and MapReduce work well on any type of data. MapReduce interprets data at run time based on the keys and values defined in the MapReduce program. Thus, a developer can design the program to work against structured, semi-structured, or even unstructured data, such as images or text.
5. Minimal Administration. Hadoop automatically handles node failures, making it easy to administer large clusters of machines and write parallelized programs that run against the cluster.
The Future of Hadoop
We are in the early days of Hadoop. There is a tremendous amount of excitement and energy around the initiative. The open source community is innovating quickly and bringing to market new capabilities that make Hadoop more database-like and a better partner in corporate data centers. For example, the community has introduced Hive, a SQL-like language that generates MapReduce programs under the covers and makes Hadoop appear more like a relational engine. It has also released Pig, a dataflow language that makes it easier to create MapReduce transformation logic than writing low-level Java.
Conversely, some BI vendors are adopting elements of Hadoop. For example, database vendors, such as Aster Data and Greenplum, have added support for MapReduce. And many relational database and ETL vendors, such as Pentaho and Talend, have implemented or announced bidirectional interfaces for moving data in and out of Hadoop. In addition, BI vendors, led by DataMeer, are working on JDBC interfaces to Hadoop so users can execute reports and queries against Hadoop from the confines of their favorite BI tool. Expect a slew of announcements this year from the likes of MicroStrategy, SAP BusinessObjects, IBM Cognos, and others supporting Hadoop.
It's clear that we’ve entered the era of big data analytics. And frameworks, such as Hadoop, are helping to advance our ability to generate valuable insights from large volumes of data and new data types. Just as exciting, the developer and data communities are converging to address large-scale data issues. And while our language and approaches may differ, it won’t be long before we all sing the same tune with the same words.
0 comments

It’s easy to get mesmerized by analytics. The science behind it can be intimidating, causing some people to abandon common sense when making decisions. Just ask financial executives of major investment houses. Blinded by complex risk models, many took on too much debt and then faltered as the economy tightened in 2008.
Relying too much on analytics is just as disastrous as ignoring it and running the business on gut instinct alone. The key is to blend analytics and instinct—or art and science, if you will—to optimize corporate decision making. Interestingly, several business intelligence (BI) leaders use the phrase “art and science” when discussing best practices for implementing analytics.
Stocking Auto Parts
For example, Advance Auto Parts, a $5 billion retailer of auto parts, recently began using analytical models to help it move from a “one size fits all” strategy for stocking inventory at its 3,500 stores to customized inventory for each store based on the characteristics of its local market. This store-specific assortment strategy has reduced non-working inventory from 20% to 4%, generating millions in cost savings.
“By blending art and science, we gain the best of each and minimize the downsides,” said Bill Robinette, director of business intelligence at Advance Auto Parts in a presentation he delivered this week at TDWI’s “Deep Analytics for Big Data” Summit in San Diego.
Advance Auto Parts sells about 600,000 unique items—everything from windshield wipers and car wax to transmissions and engines—but each store can only stock about 18,000 parts. To determine the best items that each store should carry, the company combines business rules based on the accumulated experience of store managers and executives with analytical rules derived from logistic regressions, decision trees, and neural network algorithms.
This blend of business and analytical rules has proven more accurate than using either type alone, says Robinette. Plus, it’s easier to sell analytics to long-time managers and executives if they know the models are based on commonsense rules that they created. And of course, the results speak for themselves and managers now wholeheartedly back the system.
HIPPOs and Groundhogs
Echoing the theme of blending art and science, Ken Rudin, general manager of analytics and social networking, at Zynga, an online gaming company, recently discussed the dangers of making decisions solely using intuition or analytics at TDWI’s BI Executive Summit in August.
Rudin uses the term HiPPO to explain the dangers of making decisions without facts. A HiPPO is the highest paid person’s opinion in the room. “In the absence of data, HiPPOs always win the discussion,” says Rudin. Zynga now examine every idea proposed by game designers using A/B testing on its Web site to assess whether the idea will help the company increase player retention, which is a key corporate objectives, among other things.
Conversely, Rudin says companies should avoid the “Groundhog” effect. This is when people focus too much on scientific analysis and data when making decisions. Groundhogs get caught up in the details and fail to see the big picture. As a result, they make suboptimal decisions.
For example, A/B testing revealed that players of Zynga’s Treasure Island game preferred smaller islands to minimize the amount of time they had to dig for buried treasure. Consequently, Zynga’s game designers made islands smaller to reduce churn, but each time they did, player behavior didn’t change much. What the testing missed, says Rudin, was that the players didn’t mind digging as long as they were entertained along the way, with clues for solving puzzles or notes left by friends, for example.
Happiness and fulfillment in life comes from achieving balance often by blending opposites into a unified whole. The same is true in BI. Successful BI managers combine art and science—or intuition and analytics—to achieve optimal value from their analytical investments.
0 comments
As a parent, by the time you have your second or third child, you know which battles to fight and which to avoid. It’s time we did the same in business intelligence (BI). For almost two decades we’ve tried to shoehorn both casual users and power users into the same BI architecture. But the two don’t play nicely together. Given advances in technology and the explosion in data volumes and types, it’s time we separate them and create dual BI architectures.
Mapping Architectures
Casual users are executives, managers, and front-line workers who periodically consume information created by others. They monitor daily or weekly reports and occasionally dig deeper to analyze an issue or get details. Generally, a well-designed interactive dashboard or parameterized report backed by a data warehouse with a well-designed dimensional schema is sufficient to meet these information needs. Business users who want to go a step further and build ad hoc views or reports for themselves and peers—whom I call Super Users—are best served with a semantic layer running against the same data warehouse.
Power users, on the other hand, explore data to answer unanticipated questions and issues. No predefined dashboard, report, or semantic layer is sufficient to meet their needs. They need to access data both in the data warehouse and outside of it, beyond the easy reach of most BI tools and predefined metrics and entities. They then need to dump the data into an analytical tool (e.g. Excel, SAS) so they can merge and model the data in novel and unique ways.
For years, we’ve tried to reconcile casual users and power users within the same BI architecture, but it’s a losing cause. Power users generate “runaway” queries that bog down performance in the data warehouse, and they generate hundreds or thousands of reports that overwhelm casual users. As a result, casual users reject self-service BI and revert back to old habits of requesting custom reports from IT or relying on gut feel. Meanwhile, power users exploit BI tools to proliferate spreadmarts and renegade data marts that undermine enterprise information consistency while racking up millions in hidden costs.
Time for a New Analytic Sandbox
Some forward-looking BI teams are now creating a separate analytic architecture to meet the needs of their most extreme power users. And they are relegating their data warehouses and BI tools to handle standard reporting, monitoring, and lightweight analysis.
Compared to a traditional data warehousing environment, an analytic architecture is much more free-form with fewer rules of engagement. Data does not need rigorous cleaning, mapping, or modeling, and hardcore business analysts don’t need semantic guardrails to access the data. In an analytic architecture, the onus is on the business analyst to understand source data, apply appropriate filters, and make sense of the output. Certainly, it is a “buyer beware” environment. As such, there may only be a handful of analysts in your company who are capable of using this architecture. But the insights they generate may make the endeavor well worth the effort and expense.
Types of Analytic Architectures
There are many ways to build an analytic architecture. Below are three approaches. Some BI teams implement one approach; others mix all three.
Physical Sandbox. One type of analytic architecture is uses a new analytic platform—a data warehousing appliance, columnar database, or massively parallel processing (MPP) database—to create a separate physical sandbox for their hardcore business analysts and analytical modelers. They offload complex queries from the data warehouse to these turbocharged analytical environments , and they enable analysts to upload personal or external data to those systems. This safeguards the data warehouse from runaway queries and liberates business analysts to explore large volumes of heterogeneous data without limit in a centrally managed information environment.
Virtual Sandbox. Another approach is to implement virtual sandboxes inside the data warehouse using workload management utilities. Business analysts can upload their own data to these virtual partitions, mix it with corporate data, and run complex SQL queries with impunity. These virtual sandboxes require delicate handling to keep the two populations (casual and power users) from encroaching on each other’s processing territories. But compared to a physical sandbox, it avoids having to replicate and distribute corporate data to a secondary environment that runs on a non-standard platform.
Desktop Sandboxes. Other BI teams are more courageous (or desperate) and have decided to give their hardcore analysts powerful, in-memory, desktop databases (e.g., Microsoft PowerPivot, Lyzasoft, QlikTech,Tableau, or Spotfire) into which they can download data sets from the data warehouse and other sources to explore the data at the speed of thought. Analysts get a high degree of local control and fast performance but give up data scalability compared to the other two approaches. The challenge here is preventing analysts from publishing the results of their analyses in an ad hoc manner that undermines information consistency for the enterprise.
Dual, Not Dueling Architectures
As an industry, it’s time we acknowledge the obvious: our traditional data warehousing architectures are excellent for managing reports and dashboards against standard corporate data, but they are suboptimal for managing ad hoc requests against heterogeneous data. We need dual BI architectures: one geared to casual users that supports standard, interactive reports and dashboards and lightweight analyses; and another tailored to hardcore business analysts that supports complex queries against large volumes of data.
Dual architectures does not mean dueling architectures. The two environments are complementary, not conflicting. Although companies will need to invest additional time, money, and people to manage both environments, the payoff is worth the investment: companies will get higher rates of BI usage among casual users and more game-changing insights from hardcore power users.
0 comments
Every once in a while, you encounter a breath of fresh air in the business intelligence field. Someone who approaches the field with a fresh set of eyes, a barrel full of common sense, and the courage to do things differently. We were fortunate at TDWI’s BI Executive Summit this August in San Diego to have several speakers who fit this mold.
One was Ken Rudin, general manager of analytics and social networking products, at Zynga, the online gaming company that produces Farmville and Mafia Wars, among others. Ken discussed how Zynga is “an analytics company masquerading as an online gaming company.”
Centralized High Priests
One of the many interesting things he addressed was how he reorganized his team from a centralized “high priest” model to a distributed “embedded” model. When he arrived at Zynga, studio heads or project managers would submit requests for analytical work to the corporate analytics team. According to Ken, this approach led business people to view analytics as external or separate from what they do, as something delivered by experts whose time needed to be scheduled and prioritized. In other words, they didn’t view analytics as integral to their jobs. It was someone else’s responsibility.
Another downside of the centralized model (although Ken didn’t mention this) is that analysts become less efficient. Since they are asked to analyze issues from a variety of departments, it takes them more time to get up to speed with germane business and technical issues. As a result, they can easily miss key issues or nuances that lead to below par results. Moreover, analysts serving in a “high priest” approach often feel like “short order cooks” who take requests in a reactive manner and don’t feel very engaged in the process.
Embedding Analysts
To improve the effectiveness of his analytical team, Rudin “gave away” his headcount to department heads. He said he had to go “hat in hand” and ask department heads to assume funding of his analysts. He thought the department heads would push back, but the opposite occurred: the department heads were thrilled to have analysts dedicated to their teams, and even agreed to fund more hires than Rudin proposed.
Embedding analysts in the departments helped cultivate a culture of analytics at Zynga. Each analyst became part of the team involved in designing the games. Their role was to suggest ways to test new new ideas and examine assumptions about what drives retention and longevity. By providing scientific proof of what works or doesn’t work, the embedded model created a perfect blend of “art and science” that has helped fuel Zynga’s extraordinary growth. “Art without science doesn’t work, says Rudin.
To maintain the cohesiveness of an analytical team that doesn’t report to him, Rudin holds 30 minute scrums where all analysts meet daily to share what they’ve learned and develop ideas about approaches, metrics, or tests that might apply across departments. Rudin also maintains two senior analysts who perform cross-departmental analyses.
Rudin had other gems in his presentation so stay tuned for analytical insights in this blog.
0 comments
Here’s a marriage made in heaven: combine search and business intelligence (BI) to create an easy-to-use query environment that enables even the most technophobic business users to find or explore any type of information. In other words, imagine Google for BI.
Search offers some compelling features that BI lacks: it has a brain-dead easy interface for querying information (i.e. the keyword search box made famous by Google and Yahoo); it returns results from a vast number of systems in seconds; and it can pull data from unstructured data sources, such as Web pages, documents, and email.
Of course, search lacks some key features required by BI users: namely, the ability to query structured databases, aggregate and visualize records in tabular or graph form, and apply complex calculations to base-level data. But imagine if you could build a system that delivers the best of both search and BI without any of the downsides?
Given the potential of such a union, a variety of vendors have been working for years to consummate the relationship. Some are search vendors seeking to penetrate the BI market; others are BI vendors looking to make good on the promise of self-service BI; and others are entrepreneurs who believe linguistic technology can bridge the gap between search and SQL.
Here are three approaches vendors are taking to blend search and BI technologies.
1. Faceted BI Search
Faceted BI search—for lack of a better term—is a pureplay integration of search and BI technologies. Information Builder’s Magnify is perhaps the best example of this approach, although Google has teamed up with several BI vendors to offer a search-like interface to structured data sources.
Here, a search engine indexes metadata and data generated by an ETL or reporting tool. When users type a word into the keyword search box, they receive a list of search results in the main body of the page and “facets” (i.e. categories of topics derived from metadata) in the left-hand column (see figure 1.) The results contain links to records in the source systems and reports that are executed on the fly using parameters from the search metadata. Users can also click on the facets to view subcategories and refine their search. Each time they click on a category or subcategory, a new set of result entries appear in the main body of the page.
Figure 1. Faceted Search
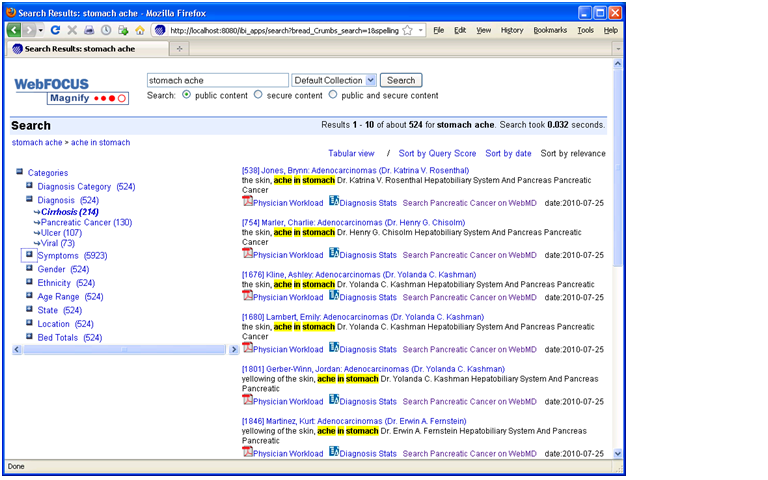
Information Builder, Inc.’s WebFocus Magnify is a BI Search product that indexes metadata and data generated by IBI’s ETL tool. The tool’s search engine displays search results in the main body of the page and dynamically generated “facets” or categories in the left-column. The search results contain links to reports that are dynamically generated based on search metadata. Source: Information Builders.
Prior to Faceted BI Search, comparable tools only indexed a BI vendor’s proprietary report files. So you could search for prerun reports in a specific format but nothing else. In contrast, Faceted BI Search dynamically generates reports based on search parameters. Furthermore, those reports can be interactive and parameterized, enabling users to continue exploring data until they find what they are looking for. In this dynamic, search becomes a precursor to reporting which facilitates exploration and analysis. So, the end user process flow is: searchàreportàexplore.
In addition, compared to prior generations of BI Search, Faceted Search indexes any content defined in metadata and fed to the search engine, including relational data, hierarchical data, documents, Web pages, and real-time events streaming across a messaging backbone. As such, the tools serve as surrogate data integration tools since they can mingle results multiple systems, including structured and unstructured data sources. It’s for this reason that in the past I’ve called Faceted Search a “poor man’s data integration tool.”
2. NLP Search
A more sophisticated approach to marrying search and BI involves natural language processing (NLP). NLP uses linguistic technology to enable a computer to extract meaning from words or phrases, such as those typed into a keyword search box. NLP breaks down the sentence structure, interprets the grammar and phrases, deciphers synonyms and parts-of-speech elements, and even resolves misspellings on the fly.
From there, the technology maps the meaning derived from keywords to metadata that describes the content of a database or document. Once this mapping occurs, the tools generate SQL queries against a database schema. All this happens instantaneously, so users can iteratively query a database using plain English rather than SQL or a complex query tool. (See figure 2.)
Figure 2. NLP Search
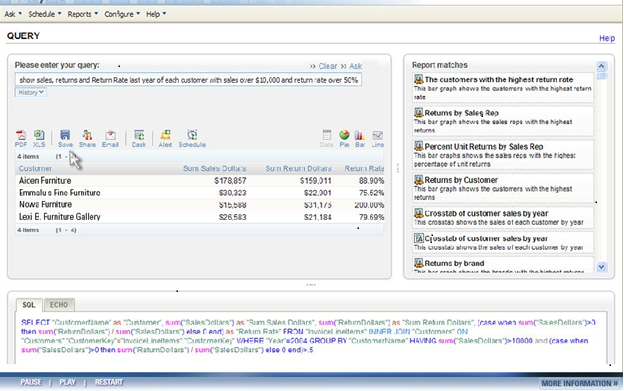
When users type a query in plain English into an NLP search box, the system suggests related reports (right pane) and hints (not shown) to refine the search. The system then maps the words to underlying database schema and generates SQL (bottom pane) which return the results (left pane), which can then be converted into a table, chart, or dashboard. Source: EasyAsk.
To make the translation between English words and phrases to SQL, the tools leverage a knowledgebase of concepts, business rules, jargon, acronyms, etc. that are germane to any business field. Most NLP tools come with knowledgebase for specific domains, including functional areas and vertical industries. Typically, NLP Search customers need to expand the knowledgebase with their own particular jargon and rules to ensure the NLP tools can translate words into SQL accurately. Often, customers must “train” a NLP Search tool on a specific database that it is going to query to maximize alignment.
While NLP tools may be a tad fussy to train and manage, they come closest to enabling users to query structured data sources. Ironically, despite their linguistic capabilities, the tools usually don’t query unstructured data sources since they are designed to generate SQL. Perhaps this limitation is one reason why pioneers in this space, EasyAsk and Semantra, have yet to gain widespread adoption.
3. Visual Search
The third approach doesn’t use search technology per se; rather, it mimics the effects of search using advanced BI tools. This type of BI Search runs a visualization tool directly against an analytic platform, usually an in-memory, columnar database with an inverted index that offers blindingly fast query performance. The combination of visualization and in-memory database tools enables users to explore sizable volumes at the speed of thought. Using a point and click paradigm, users can sort, filter, group, drill, and visual data. (See figure 3.)
Figure 3. Visual Search
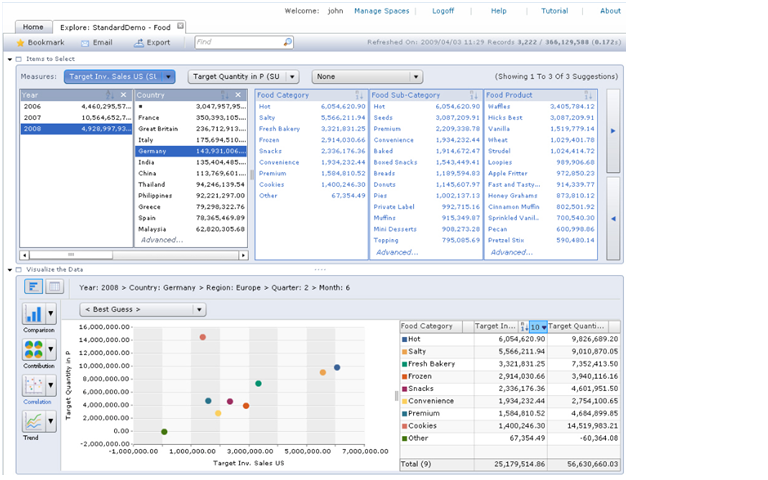
SAP BusinessObjects Explorer Accelerated marries a visualization tool with an analytic appliance (i.e., in-memory columnar database on an MPP machine) that enables users to “search” large volumes of data in an iterative manner. A user begins by typing a phrase into the keyword search box atop, which is used only to define the “information space” (i.e., the star schema) whose data will be exposed through the visual interface. Source: SAP.
Compared to Faceted BI search, which we described earlier, this approach eliminates the intermediate step of delivering individual search results or entries to users who then have to scan the entries to find one that is relevant and then click on a link to a related report. Instead, Visual Search links data directly to a visual analysis tool, giving users direct access to the information they are looking for along with the ability to dynamically interact with the data.
SAP BusinessObjects Explorer (and the recently announced Explorer Accelerated) and Endeca’s Information Access Platform are examples of Visual Search. While SAP BusinessObjects Explorer runs against star schema databases (primarily SAP BW InfoCubes today but heterogeneous databases in the near future), Endeca runs against both structured and unstructured data sources, which befits is origins as a search applications vendor.
Conclusion
BI Search is bound to gain traction in the BI market because it meets an unmet need: the ability to give casual users (i.e., executives, managers, and front-line workers) an ad hoc query tool that is simple enough to use without training.
Today, most self-service BI tools are too hard to use. And although a well-designed performance dashboard should meet 60% to 80% of the information needs of casual users, they don’t suffice for the other 20% to 40% of occasions when casual users need true ad hoc access to various information sources. Blending the best of search and BI technologies, BI search tools will fill this void.
Posted by Wayne Eckerson0 comments
It used to be that a semantic layer was the sine qua non of a sophisticated BI deployment and program. Today, I’m not so sure.
A semantic layer is a set of predefined business objects that represent corporate data in a form that is accessible to business users. These business objects, such as metrics, dimensions, and attributes, shield users from the data complexity of schema, tables, and columns in one or more back-end databases. But a semantic layer takes time to build and slows down deployment of an initial BI solution. Business Objects (now part of SAP) took its name from this notion of a semantic layer, which was the company’s chief differentiator at its inception in the early 1990s.
A semantic layer is critical for supporting ad hoc queries by non-IT professionals. As such, it’s a vital part of supporting self-service BI, which is all the rage today. So what’s my beef? Well, 80% of most BI users don’t need to create ad hoc queries. The self-service requirements of “casual users” are easily fulfilled using parameterized reports or interactive dashboards which do not require semantic layers to build or deploy.
Accordingly, most pureplay dashboard vendors don’t incorporate a semantic layer. Corda, iDashboards, Dundas, and others are fairly quick to install and deploy precisely because they have a lightweight architecture (i.e., no semantic layer). Granted, most are best used for departmental rather than enterprise deployments, but nonetheless, these low-cost, agile solutions often support sophisticated BI solutions.
Besides casual users, there are “power users” who constitute about 20% of total users. Most power users are business analysts who typically query a range of databases, including external sources. From my experience, most bonafide analysts feel constrained by a semantic layer, preferring to use SQL to examine and extract source data directly.
So is there a role for a semantic layer today? Yes, but not in the traditional sense of providing “BI to the masses” via ad hoc query and reporting tools. Since the “masses” don’t need such tools, the question becomes who does?
Super Users. The most important reason to build a semantic layer is to support a network of “super users.” Super users are technically savvy business people in each department who gravitate to BI tools and wind up building ad hoc reports on behalf of colleagues. Since super users aren’t IT professionals with formal SQL training, they need more assistance and guiderails than a typical application developer. A semantic layer ensures super users conform to standard data definitions and create accurate reports that align with enterprise standards.
Federation. Another reason a semantic layer might be warranted is when you have a federated BI architecture where power users regularly query the same sets of data from multiple sources to support a specific application. For example, a product analyst may query historical data from a warehouse, current data from sales and inventory applications, and market data from a syndicated data feed. If this usage is consistent, then the value of building a semantic layer outweighs its costs.
Distributed Development. Mature BI teams often get to the point where they become the bottleneck for development. To alleviate the backlog of projects, they distribute development tasks back out to IT professionals in each department who are capable of building data marts and complex reports and dashboards. To make distributed development work, the corporate BI team needs to establish standards for data and metric definitions, operational procedures, software development, project management, and technology. A semantic layer ensures that all developers use the same definitions for enterprise metrics, dimensions, and other business objects.
Semi-legitimate Power Users. You have inexperienced power users who don’t know how to form proper SQL and aren’t very familiar with the source systems they want to access. This type of power user is probably more akin to a super user than a business analyst and would be a good candidate for a semantic layer. However, before outfitting these users with ad hoc query tools, first determine whether a parameterized report, an interactive dashboard, or a visual analysis tool (e.g., Tableau) can meet their needs.
So there you have it. Semantic layers facilitate ad hoc query and reporting. But the only people who need ad hoc query and reporting tools these days are super users and distributed IT developers. However, if you are trying to deliver BI to the masses of casual users, then a semantic layer might not be worth the effort. Do you agree?
Posted by Wayne Eckerson0 comments