“I love the chart, but what am I supposed to do about it?” With that simple question, Ken Rudin is schooling analysts at Zynga how to deliver information that makes a difference in the way the wildly successful gaming company creates and enhances games for customers.
“My mantra these days is ‘It’s gotta be actionable,’” says Rudin, former CEO of the early BI SaaS vendor LucidEra who now runs analytics at Zynga, creators of Farmville, Mafia Wars, and other popular applications for Facebook, iPhone, and other networks. “Just showing that revenue is down doesn’t help our product managers improve the games. But if we can show the lifecycle with which a subgroup uses the game, we can open their eyes to things they never realized before.”
It’s surprising that Rudin has to do any analytics tutoring at Zynga. Its data warehouse is a critical piece of its gaming infrastructure, providing recommendations to players based on profiles compiled daily in the data warehouse and cached to memory. With over 40 million players and 3TB of new data a day, Zynga’s 200-node, columnar data warehouse from Vertica is no analytical windup toy. If it goes down for a minute, all hell breaks out because product managers have no visibility into game traffic and trends.
Moreover, the company applies A/B testing to every new feature before deploying and has a bevy of statisticians who continually dream up ways that product managers can enhance games to improve retention and collaboration among gaming users. “I’ve never seen a company that is so analytically driven. Sometimes I think we are an analytics company masquerading as a gaming company. Everything is run by the numbers,” says Rudin.
Anticipating Questions
Yet, when Rudin came to Zynga in early 2009, he discovered the analytics team was mostly in reaction mode, taking orders from product managers for custom reports. So, he split the team into two groups: 1) a reporting team that creates reports for product managers and 2) an analytics team that tests hypotheses and creates models using statistical and analytical methods. A third part of his team runs the real-time, streaming data warehousing environment.
The reporting team currently uses a home grown SQL-based tool for creating parameterized reports. Rudin hopes to migrate them to a richer, self-service dashboard environment that delivers most of the routine information that product managers need and the ability to generate ad hoc views without the help of a SQL professional.
Rudin is encouraging the analytics team to be more proactive. Instead of waiting for product managers to submit requests for hypotheses to test, analysts should suggest gaming enhancements that increase a game's "stickiness" and customer satisfaction. “It’s one thing to get answers to questions and it’s another to know what questions to ask in the first place. We need to show them novels ways that they can enhance the games to increase customer retention.”
Zynga is already an analytics powerhouse, but it sees an infinite opportunity to leverage the terabytes of data it collects daily to enhance the gaming experience of its customers. “My goal for the year is to use analytics to come up with new product innovations,” says Rudin. By proactively working with the business to improve core products, the analytics team is fast becoming an ideas factory to improve Zynga’s profitability.
Editor's Note: By the way, the Zynga Analytics team is growing as fast as the company, so if
you’re interested in talking to them, please contact Ken at [email protected].
Posted by Wayne Eckerson0 comments
Developers of BI unite! It is time that we liberate the means of BI production from our industrial past.
Too many BI teams are shackled by outdated modes of industrial organization. In our quest for efficiency, we’ve created rigid, fiefdoms of specialization that have hijacked the development process (and frankly, sucked all the enjoyment out of it as well.)
We’ve created an insidious assembly line in which business specialists document user requirements that they throw over the wall to data management specialists who create data models that they throw over the wall to data acquisition specialists who capture and transform data that they throw over the wall to reporting specialists who create reports for end users that they throw over the wall to a support team who helps users understand and troubleshoot reports.The distance from user need to fulfillment is longer than Odysseus' journey home from Troy and just as fraught with peril.
Flattened BI Teams
Contrary to standard beliefs, linear development based on specialization is highly inefficient. “Coordination [between BI groups] was killing us,” says Eric Colson, director of BI at Netflix. Colson inherited an industrialized BI team set up by managers who came from a banking environment. The first thing Colson did when he inherited the job was tear down the walls and cross-train everyone on the BI staff. “ Everyone now can handle the entire stack--from requirements to database to ETL to BI tools.”
Likewise, the data warehousing team at the University of Illinois found its project backlog growing bigger each year until it reorganized itself into nine small, self-governing interdisciplinary groups. By cross-training its staff and giving members the ability to switch groups every year, the data warehousing team doubled the number of projects it handles with the same staff.
The Power of One
Going one step further, Colson believes that even small teams are too slow. “What some people call agile is actually quite slow.” Colson believes that one developer trained in all facets of a BI stack can work faster and more effectively than a team. For example, it’s easier and quicker for one person to decide whether to apply a calculation in the ETL or BI layer than a small team, he says.
Furthermore, Colson doesn’t believe in requirements documents or quality assurance (QA) testing. He disbanded those groups when he took charge. He believes developers should work directly with users, which is something I posited in a recent blog titled the Principle of Proximity. And he thinks QA testing actually lowers quality because it relieves developers from having to understand the context of the data with which they are working.
It’s safe to say that Colson is not afraid to shake up the establishment. He admits, however, that his approach may not work everywhere: Netflix is a dynamic environment where source systems change daily so flexibility and fluidity are keys to BI success. He also reports directly to the CEO and has strong support as long as he delivers results.
Both the University of Illinois and Netflix have discovered that agility comes from a flexible organizational model and versatile individuals who have the skills and inclination to deliver complete solutions. They are BI revolutionaries who have successfully unshackled their BI organizations from the bondage of industrial era organizational models and assembly line development processes.
Posted by Wayne Eckerson0 comments
After 15 years in the business intelligence industry, I’ve hit the mother lode: I’ve discovered the true secret to BI success. It’s really quite simple, and it’s been staring at us for years. It’s the principle of proximity.
By proximity, I mean seating your BI developers next to your business experts. Not just in a joint-application design session, a requirements interview, or scrum stand-up, but ALL THE TIME! Make them work side by side, elbow to elbow, nose to nose. It doesn’t work to merely locate them on the same campus or in the same building. You need to put them in the same cubicle block, or better yet, in one big room with no walls so everyone can see, hear, smell, and touch everyone else all the time. Radical, but effective.
And don’t mistake me: I’m not talking about business requirements analysts--I’m talking about developers who write the code and design the models. Yes, make the developers get the requirements right from the horse’s mouth. Don’t force them to learn requirements second hand through a business requirements analyst. Trust me, something always gets lost in translation.
To develop awesome BI applications, you have to function like a small start up where there are no departments or organizational boundaries, no separatejargon or incentives, no separate managers or objectives, and NO WALLS. Just one big, messy, energetic, on-the-same-wavelength family that gets things done. And fast.
Role of Agile. I like agile software development methods. They come as close as any methodology to approximating the principle of proximity. If nothing else, go agile. Create a small team of business and technical people and make them do stand-up meetings daily, if not hourly! And hold them jointly accountable for the outcome.
But as good as agile can be, proximity is better. Why? When you place developers and business experts in the same room, they almost don’t need to talk. They absorb what they need to know by osmosis, and they learn to respect what each group needs to do to succeed. And fewer meetings make happier, more productive people.
Several years ago, Wes Flores, a technology manager at Verizon, told me the secret of his group’s success: “We sit side by side with business people and report into the same leadership. The only difference is that we specialize in the data and they specialize in the business process.”
So if you want to succeed at BI, reassign your business requirements analysts and immerse your BI developers in the physical heart of the business by applying the principle of proximity.
Posted by Wayne Eckerson0 comments
It’s funny how we rarely eat our own dogfood. Someone recently asked a question in TDWI’s LinkedIn group about the key performance indicators that data warehousing managers should use to measure BI/DW effectiveness. The first several respondents cited classic IT metrics, such as data transfer volume, data sizes, average ETL run times, average query response times, number of reports, number of users, etc. Then, a few people reminded everyone that KPIs, by definition, are “key”—typically, few in number, driven by top-level goals, easy to understand, and actionable.
The best KPIs drive dramatic improvements to the business. As such, there may only be one or two true KPIs per function (e.g. BI/DW) per level: operational, tactical, and strategic. Typically, each set of KPIs drives performance in the level above. Thus, operational KPIs in an operational dashboard drive tactical KPIs in a tactical dashboard which drive KPIs in a strategic dashboard. Each dashboard is used by different people at different levels of the BI/DW organization--from analysts and administrators to managers and architects to directors and sponsors--but the aligned KPIs ensure that everyone is working towards the same end.
For example, an operational dashboard measures processes in flight that enable ETL analysts, BI analysts, or database administrators to fix problems as they happen and optimize performance. At this level, KPIs for BI/DW might be: “The ETL job is spitting out a large number of errors.” “Query response times are slow.” Or “The number of users on the system is below normal.” In each case, an ETL developer, database administrator, or BI analyst respectively takes immediate action to investigate and fix the source of the problem.
A tactical dashboard measures departmental objectives and goals. In the BI/DW world, these goals are specified in service level agreements established with data warehousing customers. These might include DW availability (“The DW is refreshed at 8 a.m. week days 90% of the time”) and DW reliability (The “DW is operational 99.99% of the time between 8 a.m. and 5 p.m. Eastern time.”) These KPIs show whether the BI/DW team is on track to meet SLAs in a given time period. If not, the BI manager or architect needs to figure out why and take action to meet SLAs before it's too late.
A strategic dashboard measures how well the BI/DW team is achieving its strategic objectives. Say for example, the BI/DW team’s mission is to “Empower business users with timely, reliable data that improves decisions.” A strategic KPI could be "the number of unique BI users each week who run a report," or the "ratio of active vs inactive users each week," or the "percentage of users rating BI as “critical to making quality decisions this period'” in a semi-annual survey. Lower than expected usage should cause BI directors and sponsors to understand what inhibits usability and take steps to improve it.
Sometimes, a single strategic KPI from the BI/DW team lands on the scorecard of senior executive. The executive uses the KPI to judge the effectiveness of the BI/DW resource and make funding decisions. Thus, it’s really important to think long and hard about that single KPI and how all your efforts are focused toward achieving positive results there. This can be done if your BI/DW KPIs are aligned so that lower-level KPIs drive higher-level ones and all are based on measurements that drive actions.
Let me know what you think!!
Posted by Wayne Eckerson0 comments
I’m hearing a lot success stories about deploying BI in the cloud. I believe these stories are just the tip of the iceberg.
Last week, I delivered a Webcast with Ken Harris, CIO of Shaklee Corp., a 50-year old natural nutrition company, which has run its data warehouse in the cloud for the past four years. (Click here for the archived Webcast.) And this past year, ShareThis and RBC Wealth Management discussed their successful cloud-based BI solutions at TDWI’s BI Executive Summits this past year.
Adoption Trends
The adoption of the cloud for BI is where e-commerce was in the late 1990s: people had heard of e-commerce but laughed at the notion that a serious volume of transactions would ever take place over the wire. They said consumers would never embrace e-commerce for security reasons: people with network “sniffers” might steal their credit card numbers.
We all know how that story turned out. Today, e-commerce accounts for more than $130 billion in annual transactions, about 3.5% of total retail sales, according to the U.S. Census Bureau.
According to TDWI Research, a majority of BI professionals (51%) are either “somewhat familiar” or “very familiar” with cloud computing. About 15% of BI programs have deployed some aspect of their BI environment in the cloud today, but that percentage jumps to 53% in three years. And 7% said that either “half” or “most” of their BI solutions will run in the cloud within three years. That’s according to 183 respondents to a survey TDWI conducted at its November, 2009 conference in Orlando.
Shaklee Success
At Shaklee, the decision to move the BI environment to the cloud was a no brainer. Says CIO Harris: “It was an easy decision then, and it’s still a good one today.” Formerly a CIO at the Gap and Nike, Harris has many years of experience delivering IT and BI solutions so his word carries a lot of clout.
Harris said his team evaluated both on-premise and cloud-based solutions to replace a legacy data warehouse. They opted for a cloud-based solution from PivotLink when the vendor was able to run three of the team’s toughest queries in a three-week proof of concept. Once commissioned, PivotLink deployed the new global sales data warehouse in three months “versus 18 months” for an on-premises system, said Harris.
PivotLink “bore the brunt” of integrating data from Shaklee’s operational systems. Although Harris wouldn’t say how much data Shaklee moves to its data warehouse daily, he said the solution has spread organically and now encompasses all sales, cost, and marketing data for Shaklee, a medium-sized home-based retailer. And since Shaklee has no internal resources supporting the solution, “the cost savings are big” compared to an on-premise solution, Harris says.
SaaS Vendors. Harris was quick to point out that not all Software-as-a-Service vendors are created equally. Harris has used a number of SaaS vendors for various applications but not all have worked out and he has pulled some SaaS applications back in house. “You need a vendor that really understands SaaS, and doesn’t just put a veneer on an on-premise piece of software and business model.”
Harris added that the challenge of implementing a SaaS solution pales in comparison to the challenge of implementing BI. “SaaS is easy compared to the challenge of delivering an effective BI solution.”
Posted by Wayne Eckerson0 comments
Operational business intelligence (BI) means many things to many people. But the nub is that it delivers information to decision makers in near real time, usually within seconds, minutes, or hours. The purpose is empower front-line workers and managers with timely information so they can work proactively to improve performance.
Key Architectural Decision. This sounds easy but it’s hard to do. Low latency or operational BI systems have a lot of moving parts and there is not much time to recover from errors, especially in high-volume environments. The key decision you need to make when architecting a low-latency system is whether to use the data warehouse (DW) or not. The ramifications of this decision are significant.
On one hand, the DW will ensure the quality of low-latency data; but doing so may disrupt existing processes, add undue complexity, and adversely impact performance. On the other hand, creating a stand-alone operational BI system may be simpler and provide tailored functionality and higher performance, but potentially creates redundant copies of data that compromise data consistency and quality.
So take your pick: either add complexity by rearchitecting the DW or undermine data consistency by deploying a separate operational BI system. It’s kind of a Faustian bargain, and neither option is quick or cheap.
Within the DW
If you choose to deliver low-latency data within your existing DW, you have three options:
1. Mini Batch. One option is simply to accelerate ETL jobs by running them more frequently. If your DW supports mixed workloads (e.g. simultaneous queries and updates), this approach allows you to run the DW 24x7. Many start by loading the DW hourly and then move to 15-minute loads, if needed. Of course, your operational systems may not be designed to support continuous data extracts, so this is a consideration. Many companies start with this option since it uses existing processes and tools, but just runs them faster.
2. Change Data Capture. Another option is to apply change data capture (CDC) and replication tools which extract new records from system logs and move them in real-time to an ETL tool, staging table, flat file, or message queue so they can be loaded into the DW. This approach minimizes the impact on both your operational systems and DW since you are only updating records that have changed instead of wiping the slate clean with each load. Some companies combine both mini-batch and CDC to streamline processes even further.
3. Trickle Feed. A final option is to trickle feed records into the DW directly from an enterprise service bus (ESB), if your company has one. Here, the DW subscribes to selected events which flow through a staging area and into the DW. Most ETL vendors sell specialized ESB connectors to trickle feed data or you can program a custom interface. This is the most complex of the three approaches since there is no time to recover from a failure, but it provides the most up-to-date data possible.
Working Outside the DW
If your existing DW doesn’t lend itself to operational BI for architectural, political, or philosophical reasons, then you need to consider building or buying a complementary low-latency decision engine. There are three options here: 1) data federation 2) operational data stores 3) event-driven analytic engines.
1. Data federation. Data federation tools query and join data from multiple source systems on the fly. These tools create a virtual data mart that can combine historical and real-time data without the expense of creating a real-time DW infrastructure. Data federation tools are ideal when the number of data sources, volume of data, and complexity of queries are low.
2. ODS. Companies often use operational data stores (ODS) when they want to create operational reports that combine data from multiple systems and don’t want users to query source systems directly. An ODS extracts data from each source system in a timely fashion to create a repository of lightly integrated, current transaction data. To avoid creating redundant ETL routines and duplicate copies of data, many organizations load their DW from the ODS.
3. Event-driven engines. Event-driven analytic engines apply analytics to event data from an ESB as well as static data in a DW and other applications. The engine filters events, applies calculations and rules in memory, and triggers alerts when thresholds have been exceeded. Although tailored to meet high-volume, real-time requirements, these systems can also support general purpose BI applications.
In summary, you can architect operational BI systems in multiple ways. The key decision is whether to support operational BI inside or outside the DW. Operational BI within a DW maintains a single version of truth and ensures high quality data. But not all organizations can afford to rearchitect a DW for low latency data and must look to alternatives.
Posted by Wayne Eckerson0 comments
TDWI’s Maturity Model is represented by a bell curve spanning five stages of maturity. The curve, which represents the percentage of companies at each stage, is broken in two spots. The first is the Gulf and the second is the Chasm. (See figure 1.)
The Gulf and Chasm represent the series of obstacles and challenges that early- and later-stage programs encounter during their BI journey, respectively. Companies in the Gulf struggle with sponsorship, funding, data quality, project scope, and spreadmarts. Companies in the Chasm struggle with the politics, logistics, and dynamics of delivering an enterprise BI environment. (An enterprise environment may span the entire organization, a business unit, or profit-loss center.)
While the Gulf is difficult, the Chasm is downright perilous. Many BI programs fall into the Chasm and are never heard from again. During the next several weeks, I’ll write a series of blog posts designed to help BI professionals better understand the hazards of the Chasm and how to overcome them.
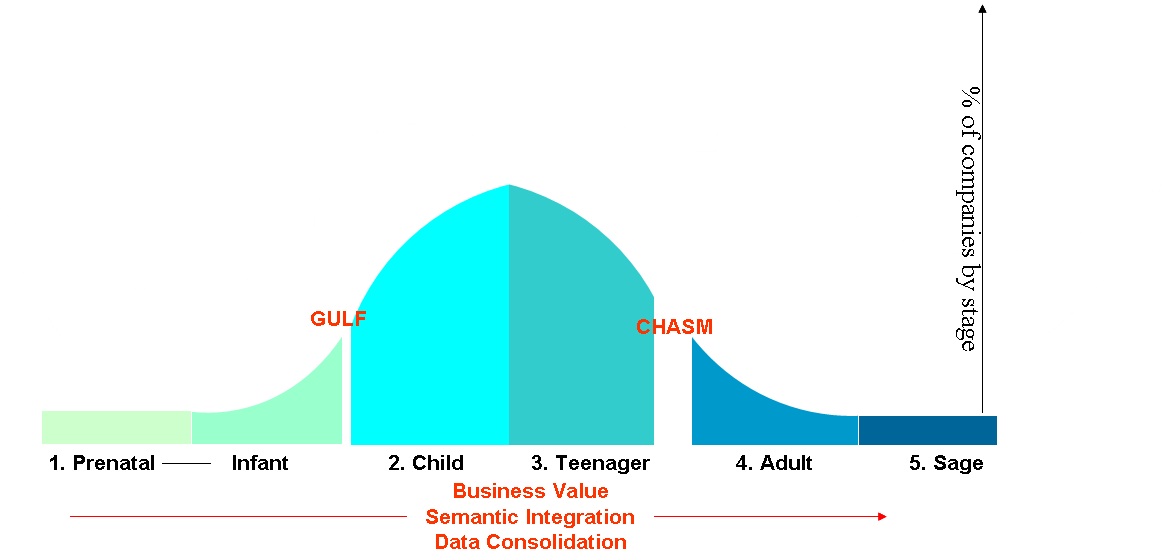
Figure 1.
From Cost-Savings to Strategic Value
The first major challenge that companies face in the Chasm is re-justifying their existence. By now, the BI team has squeezed all the cost-efficiencies out of the reporting process and must justify itself by the strategic value it offers the organization. Executives funded early data warehousing projects in part because of the projected ROI from consolidating legacy reporting systems and freeing high-priced analysts from having to manually create standard weekly or monthly reports.
Now, the BI program must do more than reduce costs and streamline IT processes. It needs to become a mission-critical resource that executives see as critical to the company’s growth. This is especially true if BI represents a sizable portion of the IT budget and employs more than a handful of full-time staffers. With a six- or seven-figure budget, the BI program has a huge bulls-eye on its back during budget season. To address the question, “What has BI done for us lately?” the BI team must have a ready and compelling answer.
Astute BI directors craft a vision for BI in business language and peddle it constantly. More than pitching proverbial “single version of truth,” they discuss how BI is critical to understanding the profitability of every customer or every product and how this information drives critical decisions about how the company invests its time, resources, and money. They talk about how BI is critical to achieving a 360-degree view of customers or suppliers and how that information has increased revenues and decreased procurements costs, respectively.
Savvy BI directors also discuss how BI is bridging the barriers between departments. For example, they talk about how finance directors and operations managers can speak the same language because general ledger data is aligned with product sales at a detailed level. They also show the company’s performance has improved since the BI team started displaying metrics with detailed, supporting data within easy-to-use dashboards and scorecards.
Talking the Talk
Of course, BI managers won’t have much to talk about if they haven’t done these or other strategic initiatives. But at least they can relay the vision they are working on, and bank on goodwill until they have tangible results to show.
But even “talking the talk” can be a stretch for some BI managers who grew up in IT with a technological perspective of the business. Thus, the first key to crossing the chasm is understanding the business and developing a strong rapport with business executives and managers by framing BI in their context.
Stay tuned for a description of the other major challenges facing companies in the Chasm in future posts.
Posted by Wayne Eckerson0 comments
I just finished writing the second draft of a report titled, “Transforming Finance: How CFOs can Use Business Intelligence to Turn Finance from Bookkeepers to Strategic Advisors.” In the report, I interviewed several so-called “spreadsheet jockeys” who dominate the financial alcoves to find out why it is so hard to get them to use BI tools instead of spreadsheets where appropriate. (The report will be published in January, 2010.)
I was lucky enough to interview a lady who used to be a financial analyst and is now in charge of business intelligence. Her perspective is revealing on why the BI team failed to meet her needs and how she is trying to change the situation.
“When I was in the planning and forecasting role within finance, the BI team would generate a report that gave me 90% of what I need. And while they felt they had addressed my needs, this was almost useless to me as I would need to rerun my manual queries to get the 10% of data that was missing. The BI team needs to understand the entire workflow. They need to ask why a financial analyst needs a report and what they are trying to accomplish.”
– Shivani Thakur, director of e-payments and business intelligence at Points.com
I was also struck by Shivani’s rationale for using Excel rather than BI tools when she was in the finance department.
“I have been one of those so-called "spreadsheet jockeys" not out of an affinity for Excel but out of necessity. Finance is under tight time pressures to crunch the numbers and provide recommendations to the business. Major decisions are made on these recommendations (e.g. whether to take or reject business or do layoffs.) The finance team cannot afford to be wrong or wait for the data to be in the right format.”
“The reason that Excel is used is because this tool is the only place where you can download reports that meet some (not all) of your needs and then adjust and/or link (i.e. integrate) the numbers accordingly. I have also worked at organizations where a new BI tool provided data in a timely and appropriate format that financial analysts could slice and dice. However, the output had to be in Excel since again the tool did not provide all the data, and it was necessary to manually link to other sources of data.”
“Yet, spreadsheet jockeys struggle with version control, linking issues, and other errors when manual intervention is required and we end up with about 15 to 20 spreadsheets all linked together. This is not a desired state for anyone in finance. But currently other alternatives are not available.”
Now as a director of BI, Shivani is frustrated by her inability to meet the needs of financial analysts like her.
“One of the things I struggle with most is how long it now takes me to respond to business requests. As a "finance geek" I was able to slice and dice numbers in a number of days by downloading reports in Excel, linking them manually and doing whatever manipulations I needed. The BI team and environment that I have adopted is not as nimble. Integrating data into our systems and then ensuring the maintenance and quality of that data is taking months to complete. It is only after this that a simple report can be built.”
Shivani’s company is in the early stages of BI, and I’ve counseled her to keep plugging along until something happens that awakens the top executives to the importance of BI to the company and to the need to invest aggressively in this area. Usually, this is a merger or acquisition, a new executive or CIO, or new competition or regulations. Hopefully, this “change event” will happen soon before her company loses a person who understands both sides of the business-IT equation and can truly make a difference.
Posted by Wayne Eckerson0 comments
There’s a lot of talk these days about the importance of self-service business intelligence (BI), but little discussion about the downsides. Unfortunately, I’ve seen self-service BI initiatives go completely awry.
Typically, a small percentage of power users employ the new-fangled tools to create tens of thousands of reports—many of which contain conflicting or inaccurate data—and this makes it harder for casual users to find the right report or trust its contents. Ironically, many turn to IT to create a custom report, which expands the report backlog that self-service BI was supposed to eliminate. In addition, many power users use the self-service tools to query large data sets that they export to Excel for analysis. These runaway queries erode query performance significantly, making the BI environment even less inviting for casual users.
So despite its allure, self-service BI can cause overall BI usage to plummet, report backlogs to grow, query performance to diminish, and information inconsistency to increase. To avoid such unintended consequences, here are five ways to implement self-service BI properly:
1. Deploy the right type of self-service BI. Power users need ad hoc report creation while casual users need ad hoc report navigation. There is a big difference. Powers users need to create reports from scratch, often accessing data from multiple locations. Casual users, on the other hand, simply want a report or dashboard that contains their top ten performance metrics and makes it easy to drill down into details, if desired.
2. Don’t abdicate responsibility for creating standard reports. To ensure that business units exploit the full value of the data warehousing resource, BI teams should take an active role in creating standard reports or dashboards for each group. This requires BI teams to get more engaged with the business, not less, which is usually what happens when an organization deploys self-service BI tools. It is not enough to create the data warehouse; if you want widespread adoption, you need to deliver the end-to-end solution.
3. Create a network of super users. Super users are technically-inclined power users in each department who function as extensions to the corporate BI team. Their job is to create ad hoc reports around the edges of the standard reports, suggest enhancements to the standard reports, and work with the BI Competency Center to define standards, select tools, and create a BI roadmap. Super users are the eyes and ears of the corporate BI team within each business group and critical to its success.
4. Liberate and manage power users. Power users can make or break a BI program. To get them on your side, give power users access to the best tools, unlimited access to data, and a sandbox within the data warehouse in which to conduct their ad hoc explorations. To ensure that they don’t proliferate spreadmarts, limit their ability to publish reports back to the server and establish a review board of power users (i.e. their peers) to examine new requests for published reports. This two-pronged approach will both empower power users to generate critical insights while minimizing their ability to foment report chaos
5. Educate executives to use standard, certified reports. For self-service BI to really work, executives need to make a companywide declaration and commitment to use standard, certified reports or dashboards when making decisions. Of course, there will always be exceptions, like when standard reports don’t contain the data needed to address issues required for a decision. But a corporate edict backed up by action makes all the difference.
Following these five steps will help your BI program achieve the holy grail of self-service BI.
Posted by Wayne Eckerson0 comments
Next year marks the 15th anniversary of TDWI, an association of data warehousing and business intelligence (BI) professionals that has grown nearly as fast as the industry it serves, which now tops $9 billion according to Forrester Research.
In 1995, when data warehousing was just another emerging information technology, most people—including some at TDWI—thought it was just another tech fad that would fade away in a few short years like others before it (e.g. artificial intelligence, computer-assisted software engineering, object-relational databases.) But data warehousing’s light never dimmed, and it has evolved rapidly to become an indispensable management tool in well-run businesses. (See figure 1.)
 Figure 1. As data warehousing has morphed into business intelligence and performance management, its purpose has evolved from historical reporting to self-service analysis to actionable insights. At each step along the way, its business value has increased.
In the beginning…
In the early days, data warehousing served a huge pent up need within organizations for a single version of corporate truth for strategic and tactical decision making and planning. It also provided a much needed, dedicated repository for reporting and analysis that wouldn’t interfere with core business systems, such as order entry and fulfillment.
What few people understood then was that data warehousing was the perfect, analytical complement to the transaction systems that dominated the business landscape. While transaction systems were great at “getting data in,” data warehouses were great at “getting data out” and doing something productive with it, like analyzing historical trends to optimize processes, monitoring and managing performance, and predicting the future. Transaction systems could not (and still can’t) do these vitally important tasks.
Phase Two: Business Intelligence
As it turns out, data warehousing was just the beginning. A data warehouse is a repository of data that is structured to conform to the way business users think and how they want to ask questions of data. (“I’d like to see sales by product, region and month for the past three years.”)
But without good tools to access, manipulate, and analyze data, users can’t drive much value from the data warehouse. So organizations began investing in easy-to-use reporting and analysis tools that would empower business users to ask questions of the data warehouse in business terms and get answers back right away without having to ask the IT department to create a custom report. Empowering business users to drive insight from data using self-service reporting and analysis tools became known as “business intelligence.”
Phase Three: Performance Management
Today, organizations value insights but they want results. Having an “intelligent” business (via business intelligence) doesn’t do much good if the insights don’t help it achieve its strategic objectives, such as growing revenues or increasing profits. In other words, organizations want to equip users with proactive information to optimize performance and achieve goals.
Accordingly, business intelligence is now morphing into performance management where organizations harness information to improve manageability, accountability, and productivity. The vehicles of choice here are dashboards and scorecards that graphically depict performance versus plan for companies, divisions, departments, workgroups and even individuals. In some cases, the graphical “key performance indicators” are updated hourly so employees have the most timely and accurate information with which to optimize the processes for which they are responsible.
Organizations have discovered that publishing performance among peer groups engenders friendly competition that turbocharges productivity. But more powerfully, these tools empower individuals and groups to work proactively to fix problems and exploit opportunities before it is too late. In this way, performance management is actionable business intelligence built on a single version of truth delivered by a data warehousing environment.
The Future
As Timbuk3 once sung, “The future looks so bright I have to wear shades.” The same could be said of business intelligence as it increasingly becomes a powerful tool for business executives to measure, monitor, and manage the health of their organizations and keep them on track towards achieving strategic goals.
Posted by Wayne Eckerson0 comments