
Data Stories: Visualizing Vegetable Species, Pizza Costs, and Food-Themed Charts
Check out these visualizations to learn about broccoli, pizza, and how to build several basic chart types.
- By Upside Staff
- May 20, 2020
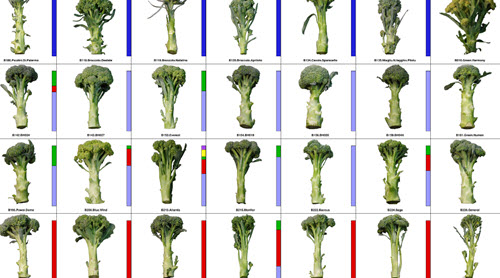
Graduate student Zachary Stansell is studying genetic diversity in broccoli and created a large visualization to display 97 different varieties.
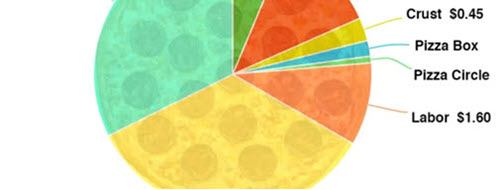
This article on The Takeout breaks down cost and profit for an independent pizzeria.
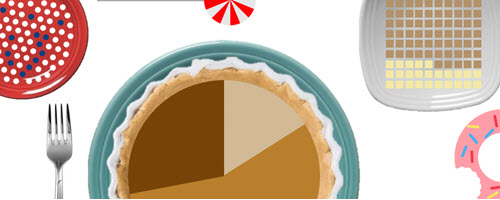
This Tableau workbook shows five types of charts that look like food. Click on each for a quick tutorial on creating your own.