
Business Intelligence Observability: The Missing Layer of Modern Analytics
Organizations that treat BI as an operational system will be better positioned to build trusted foundations for the next generation of AI.
- By Rupesh Ghosh
- October 7, 2026
For years, organizations have invested heavily in making data platforms more reliable. Infrastructure is monitored around the clock. Data pipelines generate alerts when jobs fail. Data quality frameworks identify anomalies before they reach downstream systems. Cloud platforms provide detailed information on resource utilization, availability, and cost.
These investments have improved the reliability of enterprise data environments. Yet one important layer often remains difficult to observe: the business intelligence platform itself.
Modern organizations depend on dashboards to support operational decisions throughout the day. Sales teams monitor revenue, supply chain teams adjust inventory, finance departments track budgets and forecasts, and executives rely on dashboards during leadership meetings. In many organizations, business intelligence has become the main interface between employees and enterprise data.
Despite this shift, BI monitoring is still often limited to technical indicators such as successful refreshes, completed pipelines, and available infrastructure.
These measures are necessary, but they do not provide a complete view of platform health.
A dashboard can remain available while becoming slower each month. A semantic model can refresh successfully while using substantially more compute than it did previously. A business-critical report can continue operating without a clear owner. Several reports can calculate the same metric differently without triggering any technical alert.
From an infrastructure perspective, nothing has failed.
From a business perspective, the analytics platform has become less dependable.
This gap points to the need for a broader operational discipline: business intelligence observability.
Business intelligence observability is the practice of continuously measuring the operational health of analytical assets so organizations can ensure dashboards remain reliable, performant, trusted, and ready to support both human and AI-driven decision making.
Looking Beyond Data Delivery
Traditional monitoring is designed to determine whether technical systems are working as expected. Engineers use logs, alerts, metrics, and traces to understand infrastructure, applications, databases, and pipelines.
However, the analytical layer introduces different questions.
Once data reaches a semantic model or dashboard, success is no longer measured only by whether the data arrived. It must also be measured by whether users can access it quickly, understand it consistently, and trust it enough to make decisions.
Traditional monitoring often stops at data delivery.
BI observability continues through the consumption layer.
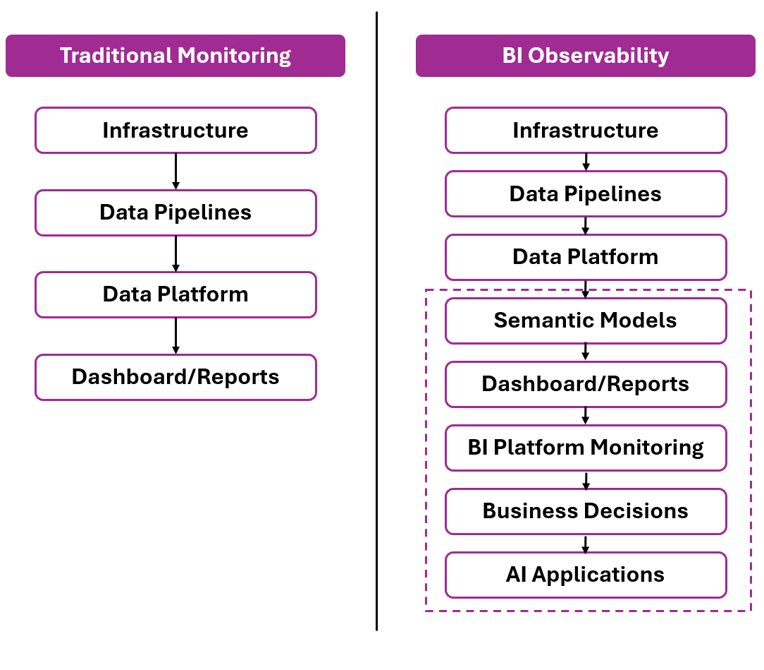
Figure 1. Traditional monitoring versus BI observability
Visibility extends across the full analytical life cycle.
A pipeline may complete successfully while a model change doubles report response times. Compute consumption may increase even though user activity remains stable. Hundreds of reports may remain published despite receiving little or no usage.
None of these situations necessarily represent a system failure. However, each can reduce the value, efficiency, or reliability of the analytics environment.
That is where business intelligence observability begins.
Defining Business Intelligence Observability
Business intelligence observability extends monitoring beyond infrastructure into the layer where users interact with business information.
Rather than asking only whether reports are available, it asks whether the platform continues to deliver reliable, efficient, and trustworthy decision support over time.
This changes the questions BI teams ask.
Instead of focusing only on whether a refresh failed, teams can ask:
- Which reports have gradually become slower?
- Which models consume the most resources relative to their usage?
- Which workspaces experience recurring capacity pressure?
- Which critical dashboards lack ownership?
- Which reports are rarely used and may no longer be needed?
- Which data sets should be treated as authoritative?
These questions require more than infrastructure telemetry. They require performance history, usage data, governance metadata, ownership information, business criticality, and resource consumption to be considered together.
The goal is not simply to detect failures. The goal is to understand whether the analytics environment is becoming healthier or less healthy over time.
Five Dimensions of BI Observability
Although organizations collect many BI metrics, most operational questions fall into five connected dimensions.
Together, these dimensions provide a practical framework for evaluating the health of a modern business intelligence platform.
Reliability
Reliability measures whether users can consistently access trusted analytical information. It includes more than refresh completion. Query success, report availability, model stability, and consistency of business metrics also matter.
Observability / Performance
Performance measures how efficiently users interact with reports and analytical models. Load time, query duration, responsiveness, and long-term degradation should be evaluated as trends rather than isolated numbers.
Capacity
Capacity measures how resources are consumed across reports, models, workspaces, and workloads. It helps identify inefficient designs, recurring pressure, and scaling risks before they affect users.
Adoption
Adoption measures whether analytical assets are delivering business value. Heavily used dashboards may deserve greater operational protection, while unused reports may represent unnecessary maintenance and cost.
Governance
Governance connects technical assets with accountability. Ownership, certification, business criticality, lineage, and trusted definitions make operational metrics actionable.
Individually, each dimension provides useful information. Together, they provide a fuller view of BI health.
From Technical Status to Business Impact
The most important change introduced by BI observability is the shift from technical status to business impact.
A successful refresh is useful information, but it does not confirm that a report is fast, trusted, actively used, or properly governed.
|
Traditional Monitoring
|
BI Observability
|
|
Refresh completed
|
Report performance trend
|
|
Pipeline succeeded
|
User decision experience
|
|
Compute usage
|
Compute efficiency by asset
|
|
Service available
|
Business-critical asset health
|
|
Storage utilization
|
Adoption and governance
|
Figure 2. Metrics for traditional monitoring compared with BI observability
In other words, traditional monitoring answers whether the platform is operating, while BI observability answers whether the platform is delivering business value.
This shift also changes how BI teams operate. Instead of waiting for users to report problems, teams can identify gradual performance degradation, rising resource consumption, orphaned assets, and declining adoption earlier.
That makes monitoring proactive rather than reactive.
Why BI Observability Matters for AI
The need for BI observability is becoming more important as organizations introduce enterprise AI.
AI assistants and natural-language analytics tools increasingly rely on semantic models, governed data sets, and standardized business definitions. They often use the same analytical assets that support human decision-makers.
If those assets are duplicated, outdated, inefficient, or poorly governed, AI systems inherit the same weaknesses.
An AI system may return an answer quickly while using the wrong metric definition. It may query an outdated model because ownership and certification are unclear. It may depend on an expensive analytical workload that is technically successful but operationally inefficient.
Infrastructure monitoring alone cannot reveal these risks.
BI observability provides the visibility needed to determine whether the analytical foundation supporting AI is reliable, governed, and sustainable.
Enterprise AI depends on trusted analytical foundations. If semantic models are duplicated, governance is inconsistent, or certified metrics are poorly defined, AI systems can generate technically correct answers that are operationally misleading. BI observability helps organizations identify these risks before they affect decision-making.
Moving Toward an Observable BI Platform
Most organizations already possess much of the information required to begin. Usage telemetry, performance metrics, model metadata, capacity data, ownership records, and historical trends often exist across separate administrative tools.
The opportunity is not simply to collect more data.
It is to connect operational and governance information into a unified view of how the BI platform supports business decisions.
Organizations have spent years making infrastructure and data pipelines observable. The next step is to make the business intelligence layer equally transparent.
As BI evolves from a reporting function into a production decision system, platform health should no longer be measured only by whether data arrives successfully. It should be measured by whether people, and increasingly AI, can continue making timely and trustworthy decisions using the analytical assets the organization depends on.
Organizations that treat business intelligence as an operational system rather than a reporting layer will be better positioned to improve user experience, reduce operational risk, and build trusted analytical foundations for the next generation of AI.
About the Author
Rupesh Ghosh is a lead business intelligence engineer at Total Wine & More. In his career, Ghosh has architected scalable BI systems across cloud platforms, pioneered cost-optimized analytics strategies in enterprise environments, and contributed thought leadership on modern data architectures and AI-ready BI systems. You can reach the author at [email protected] or https://www.linkedin.com/in/rupeshghosh/.