
Data Stories: Framing Trends, Language Learning, Best Around the World
Understanding global statistics over time, what languages people want to learn, and positive facts about various countries.
- By Upside Staff
- December 22, 2021
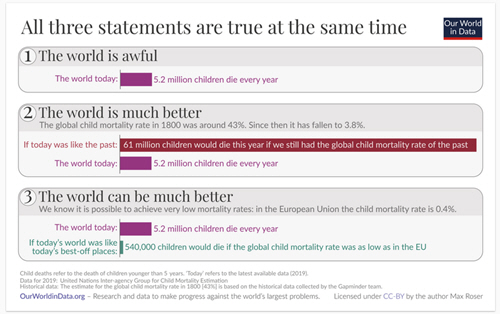
This chart and article from Our World in Data illustrates how really understanding a statistic means understanding both how it has changed over time and how it could continue to change for the better.
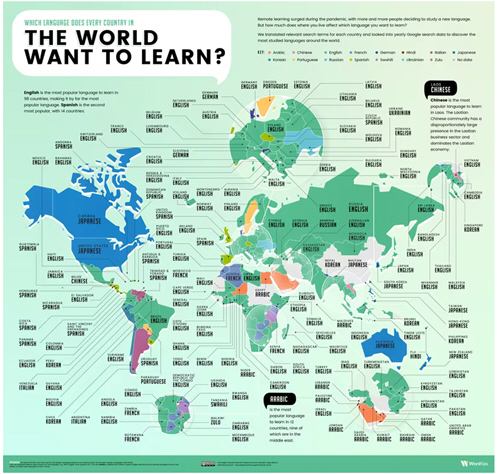
The maps in this article illustrate interest in language learning around the world.
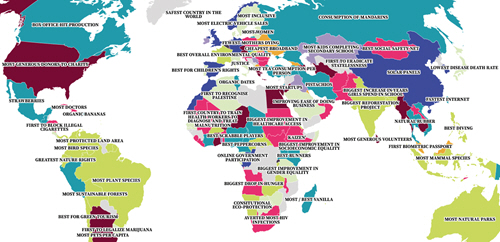
The folks at Information Is Beautiful found something that almost every country either does best or is particularly nice about that place and made an infographic and an interactive map.