
Data Stories: Tools and Resources for Data Visualization
Need to pick the right tool or the best technique for your data visualization? Check these sources for up-to-date advice.
- By Upside Staff
- September 25, 2019
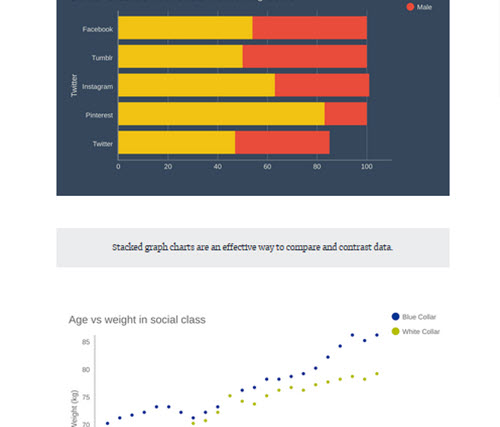
This post from talent network Toptal provides clear explanations of the pros and cons of today’s major data visualization tools.
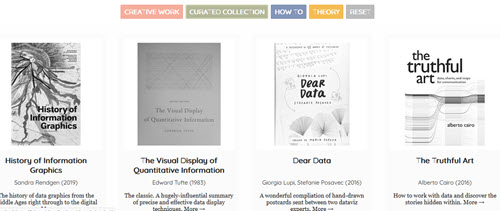
Need more in-depth guidance? Here’s a data visualization about recommended books that teach data visualization. Sort with the simple filters at the top.
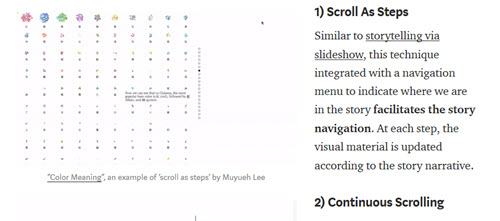
One of the most popular modern data visualization styles is “scrollytelling,” an online format where a data story is revealed to readers in stages as they scroll down a webpage. Learn the basics of this technique with this Medium post from The Data Visualization Society.