
Data Stories: The Benefits of Gorgeous Data Visualizations
These three examples of data visualization lean more towards beauty than detailed communication. Sometimes visualizations need specific drill-down abilities, but sometimes you just need to create an impression.
- By Upside Staff
- July 17, 2019
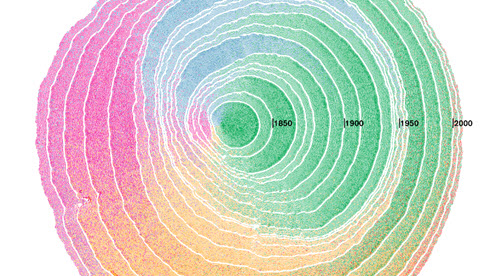
This Northeastern University project imagines immigration and population in the U.S. growing like the rings of a tree.

This stunning interactive visualization contains a ton of detail about thousands of historic coins kept in the Münzkabinett (Numismatic Collection) in Berlin, but the presentation prioritizes the experience of enjoying the look and variety of the coins.

The creator of this solar system map makes information about the data, data cleansing process, and design tools she used freely available, but it still takes a designer’s skill to create something that looks this nice.