
Data Stories: Candy, Costumes, and Tutorials for Halloween
See which candy sells the most, how to chart the quality of Halloween television episodes, and how to visualize what costumes were most popular last year.
- By Upside Staff
- October 31, 2018
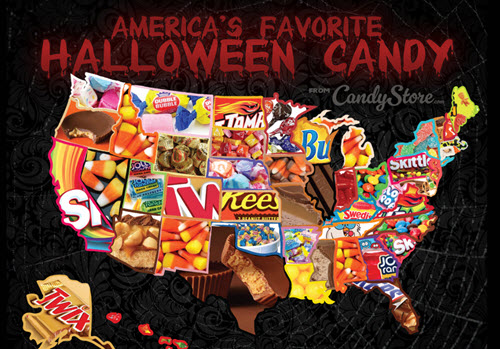
CandyStore.com provides this fun map of the best-selling candies leading up to Halloween. In the full interactive version, you can hover over a state to see the top three contenders.
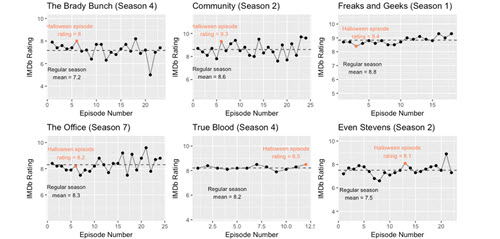
The author of this article used statistical tests on data from IMDB.com to find out whether Halloween-themed television episodes had higher ratings than average.
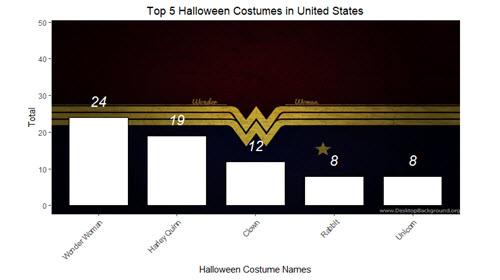
Ready to do your own visualization? This in-depth tutorial demonstrates how to explore raw costume trend data with R and then take it all the way to a final data visualization.