
Data Stories: Visualizations Show Where People Work, Live, and Play
See the best cities for start-ups, explore population movement, and observe trends in how people spend their time.
- By Lindsay Stares
- June 15, 2016
Where Should You Base Your Start-Up?
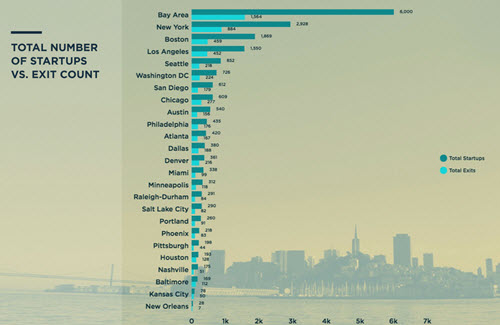
Start-up “incubator” 1776 released a report ranking the best cities across the U.S. for start-ups and the digital economy. The infographic summarizes the key findings, but you can also download the full report for additional charts. The researchers looked at a range of factors including population education, quality of life, and support for start-ups.
Migration within the United States
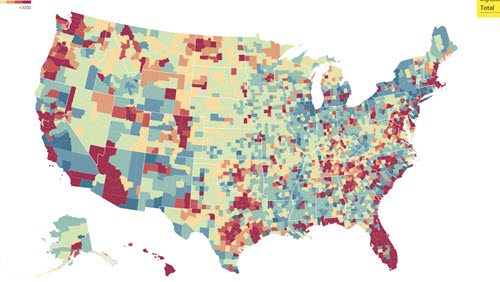
Now that you have some cities in mind, take a look at how many people are moving to or from those areas. This map from Braid shows recent population change across the U.S. You can zoom in to view counties by clicking on a state or limit to either domestic or international migration on the side.
How Americans Spend Their Time
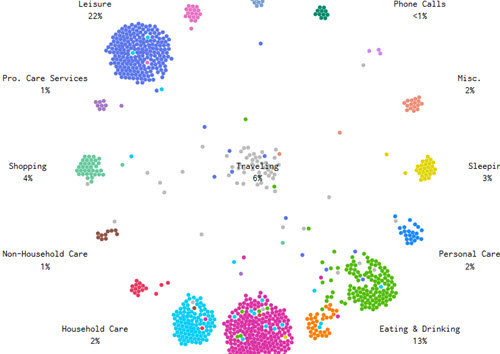
You can’t spend your whole day at work. Watch this amazing animation based on the American Time Use Survey to see how 1,000 typical Americans spend an average weekday. Adjust the speed on the side and read the whole blog for more details.
About the Author
Lindsay Stares is a production editor at TDWI. You can contact her here.