
Data Stories: Exploring Federal Finance
These data visualizations investigate tax regulations, state budgets, and government spending in the U.S.
- By Upside Staff
- March 10, 2021
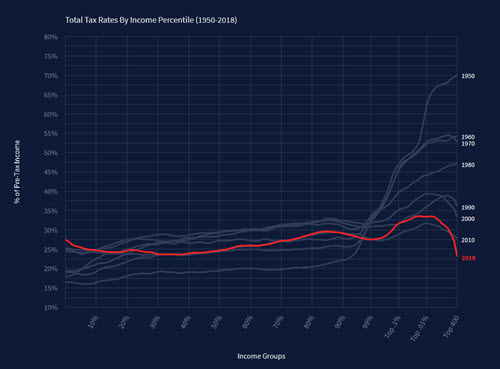
This website developed by economics professors and students provides interactive graphs that allow you to explore the American tax system and the effect different tax plans would have on different income groups.
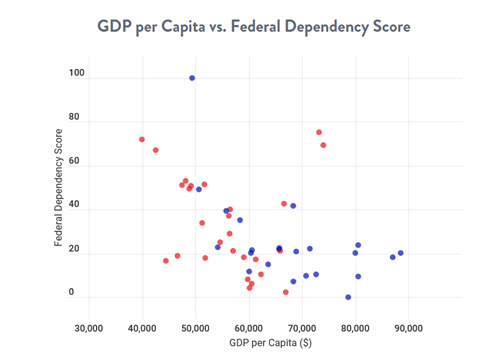
This article from Money Geek explores how much states in the U.S. rely on funds from the federal government. Multiple charts compare this statistic with other political and financial trends.
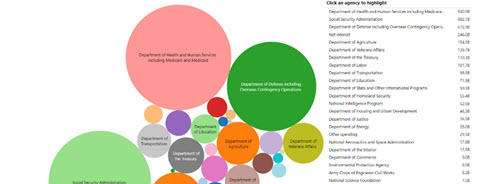
This blog post from the Data School demonstrates some tactics for revising a data visualization to increase clarity. The example concerns U.S. government spending in 2013.