
Data Stories: Television, Movies, and Books
These data visualizations show popular shows, hallmarks of movie genres, and how authors describe characters.
- By Upside Staff
- December 23, 2020
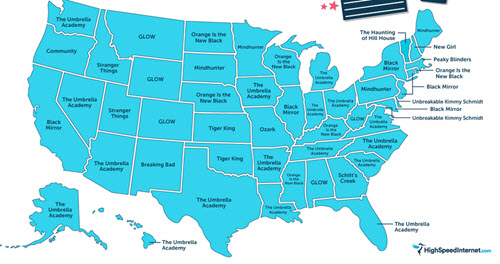
This simple map from HighSpeedInternet.com presents which Netflix shows were searched for the most in each U.S. state this year. A similar map displays interest in shows on HBO Max.
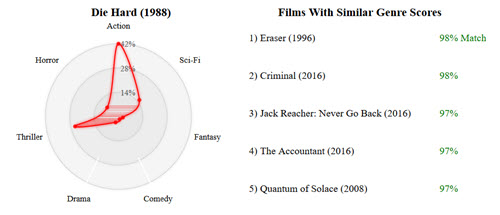
How would you define an action movie versus a sci-fi movie? This project from Culture Plot found genre-specific keywords and used them to build interactive visualizations that show how genres mix.
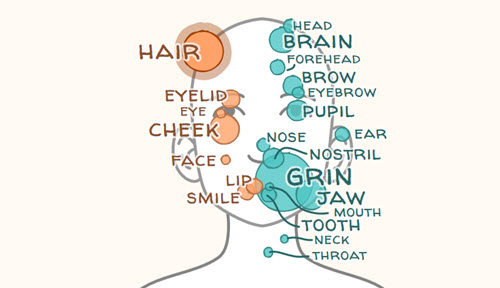
This text analysis project from The Pudding shows how often authors use different terms to describe male and female characters.