Optimizing Patient Flow at Johns Hopkins Hospital
Commentary by
Doug Brooks, Director of Finance, Department of
Medicine, Johns Hopkins University
Hetal Rupani, Senior Project Analyst, Johns Hopkins
School of Medicine
Murali Padmanaban, IT Manager, Financial Systems
Administration, Johns Hopkins University
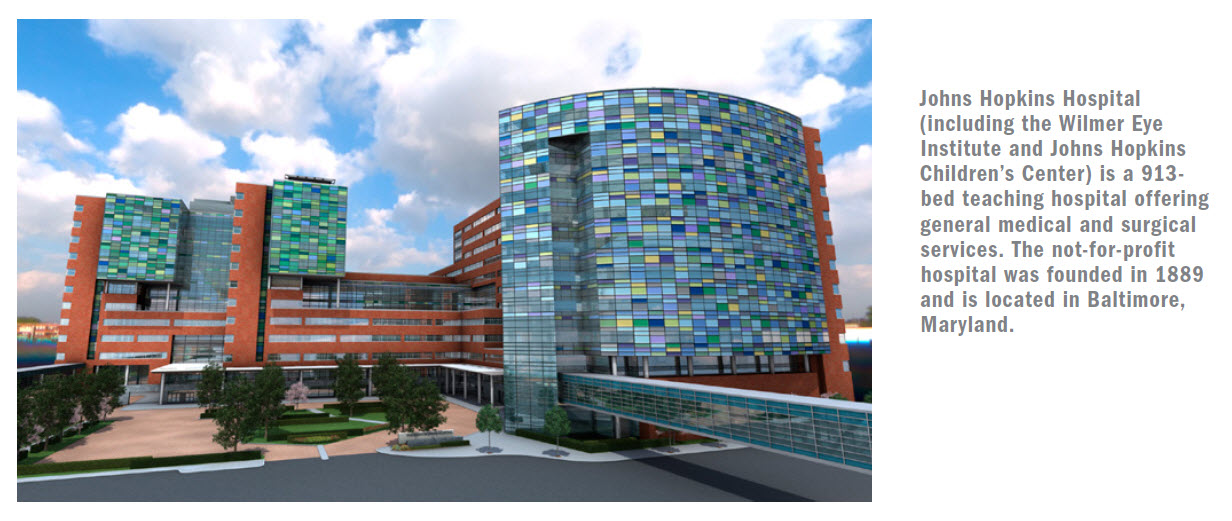
Johns Hopkins Hospital wanted to serve
more patients while preserving its excellent
level of care. In 2012, the hospital was
ranked number one in the U.S. in 16 different
specialties, according to U.S. News and
World Report.
Demand for Johns Hopkins Hospital’s
services is strong. The hospital’s outstanding
reputation means that many patients
across the U.S. choose it for their medical
needs. Because of its urban setting, the
hospital naturally serves a large population,
frequently through its adult and pediatric
emergency departments (ED).
Moving patients through the ED effectively is
a critical capability for the hospital. A 2010
review of ED figures indicated that 34 percent
of all adult patients and more than 50
percent of pediatric patients were admitted
through the ED.
A Fractured View Leaves Opportunities
for Efficiency
Patient flow, particularly from the ED, was
an area the hospital felt had potential to
improve. Decreasing time to admittance
would require a real-time view of inpatient
bed supply and demand and an understanding
of barriers to patient discharge across
the entire hospital.
Doug Brooks, director of finance for Johns
Hopkins Department of Medicine at Johns
Hopkins University, notes that teams within
the hospital often work independently,
making it difficult to gain the necessary
holistic view.
“We knew parts,” Brooks said of the view
across departments. “We could check out
different systems and different data sets to
find that information, but it was slow.”
The Department of Medicine used six different
data sources to report on patient flow.
“It would take a month; it would take a
week. Sometimes it would only take a day,”
said Brooks. Unfortunately, even the next-day
reports didn’t help teams proactively
manage patient flow.
Hetal Rupani, senior project analyst at Johns
Hopkins School of Medicine, describes the
process of running those reports as a real
challenge.
“I would be pulling my hair with Microsoft
Excel, Microsoft Access, updating my report
every month, running the same query again
and again and troubleshooting why the
query was not running,” she said.
There Has to Be a Better Way
Instead of tinkering with her existing reporting
systems, Rupani wanted to get to the
root of the problem.
“We were looking for a solution that could
actually help us analyze our data more
effectively,” said Rupani. “Instead of getting
feedback from different users [and putting
it into] the reporting format with all the numbers,
we wanted to look at the process and
fix it right then and there.”
An effective solution would have to be
adopted not just by technologists and data
analysts, but also by doctors, nurses, administrators,
and others on the front lines.
The team knew that mobile access across
multiple devices would make a big difference
in user adoption of any new solution.
Nurses and doctors were unlikely to carry a
laptop around, but many were already using
tablet devices.
“I think the ease of access and ease of carrying
a small device in your hand rather than
a big laptop makes a big difference,” said
Rupani.
A Trusted Colleague Puts Them on the
Right Path
Rupani began experimenting with Tableau
Software after receiving a report from
another department in the form of a packaged
workbook.
She was able to download the free Tableau
Reader to open the workbook and interact
with the report. The experience piqued her
interest. “When I got the report I wanted to
know more about Tableau,” Rupani said.
Adding to her desire to learn more, the
report was from an esteemed source: the
central data warehousing department at
Johns Hopkins. “I really respect the senior
director of that department and I trust his
judgment about the products he purchases,”
she said.
The hospital decided to adopt Tableau
Server. It has integrated Tableau Server with
its custom internal portal so any user with
the right credentials can access Tableau
dashboards through connected devices,
including tablets.
The hospital is blending several data sources
for its dashboards. “We bring all of this data
into a data repository,” explained Murali
Padmanaban, IT manager of the financial
systems administration at Johns Hopkins
University. “That’s what feeds into our Tableau
dashboards.”
Real Time Is the Best Time
Now users across different departments
are looking at the same real-time data and
making decisions based on facts rather than
guesses about patient bed availability and
need.
“For example, we’re able to call an emergency
meeting at eleven o’clock and everyone is looking at the same data at the
same time,” said Brooks. “Nobody has to
prepare or publish a report. People are looking
at it and we can create a plan of action
at that moment.”
Anywhere Access on Users’
Preferred Devices
Because users can view and interact with
Tableau visualizations on a variety of mobile
devices, caregivers at Johns Hopkins are
able to keep up with changes in patient flow
through their tablets, devices they were
already accustomed to carrying. This has
made user adoption much easier for the
hospital.
“Almost everyone carries a tablet nowadays,
so having an app and making it accessible
is just incredible; it makes it easier to access
information,” said Padmanaban.
Implementing Tableau has made a difference
that has been felt across the hospital.
“All of the information so far has been used
by everyone, from senior leadership of the
hospital itself down to the shift coordinators
who are responsible for finding beds for the
patients,” said Brooks.
“This dashboard has brought everybody
together,” he added. “Everybody is looking at
the same data at the same time, and acting
in a unified fashion.”
The Eyes Are the Window to the Data
The visual way information is presented in
Tableau helps end users key in on important
information much faster than they would if
they were looking at a collection of numbers
in a spreadsheet, said Padmanaban.
“What Tableau does better is visualization. If
you look at Tableau, it is meant for eyes,” he
said. Through visualization, data trends and
outliers are easy to see.
“It’s just implicit. It’s what stands out,” Padmanaban
said.
Turning Data into Stories
Converting dry numbers into dashboards
and interactive visualizations that allow
users to quickly see problems and trends
has been a valuable aid to communication
for the hospital. “To me, data is data,” said
Padmanaban. “But to a front-end user, it’s
completely different.”
Brooks noted that Tableau gives data power
users the ability to tell the story of the data.
“It gives creativity to the people that need it
the most,” he said.
Great-Looking Data Makes People
Look Good, Too
According to Rupani and Brooks, implementing
Tableau has added a bit of sheen to their
professional reputations.
“I partially owe it to Tableau for my professional
growth in the organization,” said
Rupani. “Tableau has helped put me in front
of the senior leadership.”
Brooks agreed. “It’s really brought the
Department of Medicine to the forefront
of hospital leadership’s attention. We have
really gained a reputation as being an innovative
department.”