
Data Stories: Dashboards Versus Storytelling, Python Charts, Motion Capture
Why dashboards aren’t the same as data stories, tips for making charts in Python, and an open source motion capture project.
- By Upside Staff
- December 15, 2021
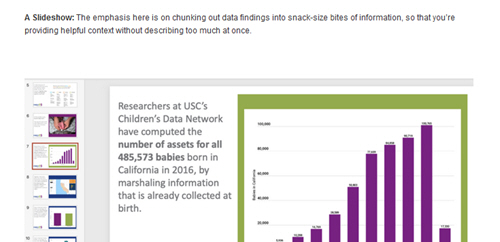
This article from the journal of the Data Visualization Society explains why dashboards aren’t interchangeable with data storytelling and gives some suggestions for data communication.
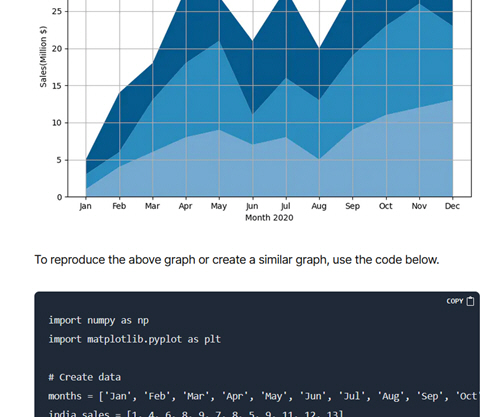
This article provides instructions for creating various types of charts in Python with Matplotlib.
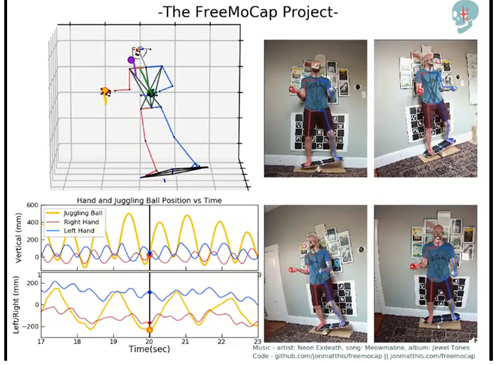
This post shows off a trial run of an open source motion capture project. The team is hoping to make motion capture technology much more generally accessible.