
Data Stories: Best Science Visualizations
This week, we look at interactive websites and other visualizations of complex scientific concepts.
- By Upside Staff
- August 14, 2019
Light From the Center of the Galaxy
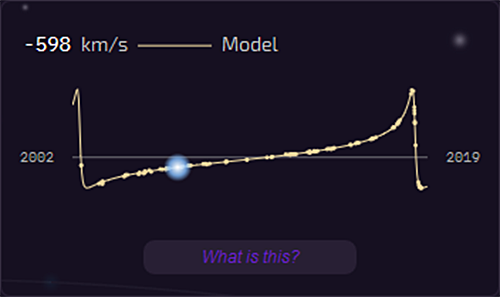
This interactive website shows how a star orbiting the center of the Milky Way enabled scientists to confirm Einstein's General Theory of Relativity.
The 8 Best Science Images, Videos, and Visualizations of the Year
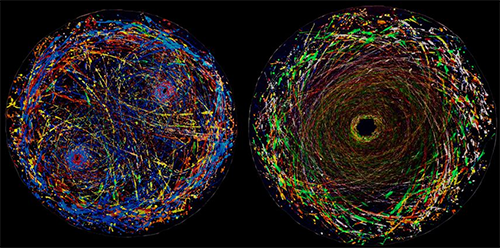
Awarded each year by the National Science Foundation, the Vizzies Challenge features the year's best science visualizations. These winners from 2018 illustrate concepts as varied as computational geometry and gravity wells.
The Atlas of Moons
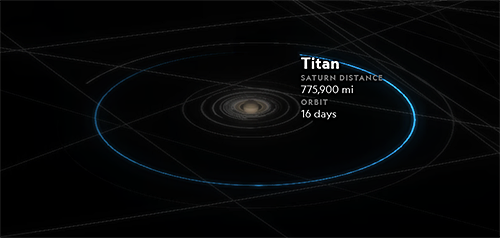
Check out this animated tour of the nearly 200 known moons orbiting throughout our solar system.