
Data Stories: Tips and Tricks for Better Visualizations
Looking for inspiration for your data visualizations? Learn from great examples of data journalism and explore the landscape of available tools.
- By Upside Staff
- July 10, 2019

The data journalism professionals at The Pudding explain how they structure and design visualizations in this article, which includes an example of brainstorming and iteration.
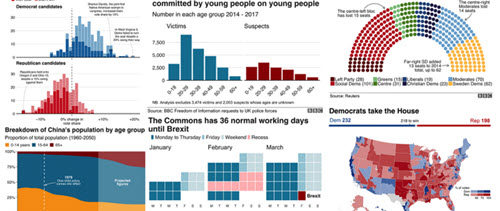
The BBC’s data journalism team has overhauled the way they create visualizations over the past year using R. Learn all about their process in this post on Medium.
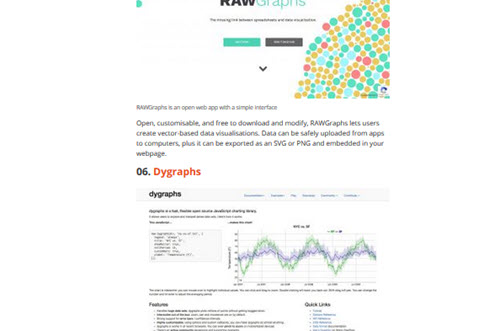
Here’s a quick breakdown of 35 popular data visualization tools from the Creative Bloq design blog.