
Data Stories: Creating the Right Data Visualization
Pick the right type of visualization for your data, find tools based on your technical ability, and get inspired by award-winning designs.
- By Upside Staff
- April 3, 2019
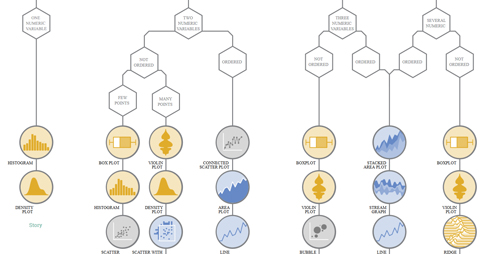
Use the decision tree at data-to-viz.com to explore different types of data visualizations. Start with the type of data you have and click to learn more about each type of graph.
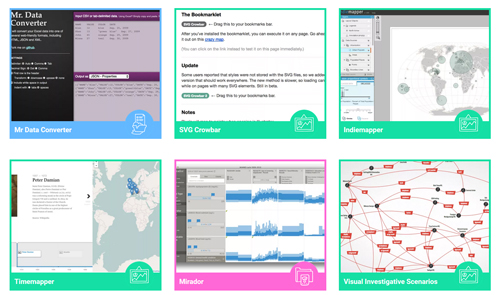
Data journalism continues to grow in popularity across many subject areas. If you want to experiment with visualizations, this simple drop-down menu suggests tools based on your experience and needs.
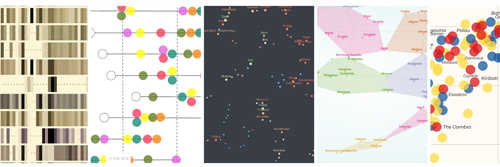
Still need more inspiration? Learn about the winners of the World Data Visualization Prize 2019. Each entry started with the same theme (how governments are improving citizens' lives and the innovations and decisions that drive progress), but each came up with a unique approach.