
Data Stories: Make Better Infographics, Interactive Visualizations, and Bubble Charts
Develop compelling infographics, how interactivity can enhance storytelling, and learn to code a chart with D3.
- By Lindsay Stares
- June 7, 2017
Make Great Infographics

Learn to make compelling, shareable infographics from the team at Column Five Media. After making over 4,000 infographics, they shared their in-depth development strategy.
Designing to Promote Exploration
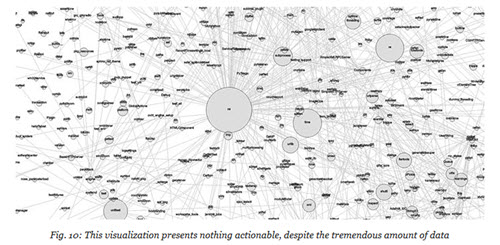
In this article, designer Byron Houwens considers the difficulties in visualizing enormous data sets. He argues that the most effective storytelling may be found in interactive visualizations that invite users to discover their own narratives.
Learn to Code Visualizations with D3
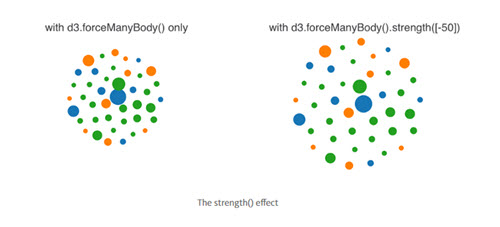
Interested in learning to work with the D3 JavaScript library? Try this tutorial for creating a simple bubble chart.
About the Author
Lindsay Stares is a production editor at TDWI. You can contact her here.