IBM Cognos laid out a roadmap for the future and provided a deep dive into the elements of its next major release (due Q2, 2010) in its fourth annual Industry Analyst Summit in Ottawa this week.
Due to confidentiality agreements, there is not much I can discuss publicly about future releases. However, it was refreshing to know that despite being swallowed up by IBM, the original Cognos executive team is still intact, and they seem as engaged and excited as ever. The next release contains many breakthrough features that will make the IBM Cognos offerings extremely compelling.
IBM executives have made a sizable strategic commitment to business analytics and optimization as a major growth area for the $100 billion company. As a consequence, IBM Cognos is playing a pivotal role at IBM, and some of its executives have been tapped to lead the charge corporatewide. To align with the strategy, many IBM business units have been eager to partner with the Cognos team, making it like the proverbial kid in a candy store, able to pick and choose its best go-to-market opportunities. For example, IBM Cognos played a key part in IBM’s recent SmartAnalytics announcement. (See “IBM Rediscovers Itself.”)
With IBM opening many new channels and markets and expanding Cognos’ development and marketing resources, IBM Cognos is experiencing a financial uplift. Rob Ashe, IBM’s general manager of business intelligence and performance management, announced by video that IBM Cognos has grown license revenues by 30% this past year.
IBM Cognos Express
While at the event, IBM Cognos announced its new mid-market product, IBM Cognos Express. Although it’s lagged behind competitors in delivering a product in this space, IBM Cognos may end up the winner. Instead of just repackaging its enterprise product with a different license model, IBM Cognos has thought long and hard about what mid-market customers need and subsequently created an entirely new end-to-end product designed suit those requirements. IBM Cognos Express borrows IBM and Cognos technologies to deliver a product that is easy to buy, simple to install, easy to use, and easy to maintain.
IBM Cognos Express offers integrated modules for query, reporting, analysis, visualization, dashboarding, and planning. Once installed, the product essentially creates a local data mart (via TM1) behind the scenes. The product supports a maximum of 100 users running a single server. And here’s the one downside: if users outgrow the IBM Cognos Express solution, they can either purchase another Express server or buy and install IBM Cognos 8 BI and migrate their data, models, and reports.
Pricing starts at $12,500, with fees for users, administrators, and data connectors. What’s most interesting is that prospects can download and try the product for 30 days and even finance the purchase from IBM Global Financing. On the surface, this product should resonate well with the mid-market. It’s good to see a company that tries to understand its customers before shoving products down their throats!
Posted by Wayne Eckerson0 comments
If you think that semantics is a huge problem for data warehousing initiatives—and it is—it’s an even bigger problem for our industry at large.
Take the word analytics, for example. It’s a popular term right now: reporting is passé; everyone wants to do “analytics.” And like most popular terms, it’s been completely bastardized. This is largely because vendors want to exploit any term that is popular and bend it to match their current or future product portfolios. But it’s also because we’re too complacent, uninformed, or busy to quibble with exact meanings—that is, until we have to plunk down cold, hard cash or risk our reputation on a new product. Then we care about semantics.
Most vendors use the term analytics to describe what I would call “interactive reporting.” Evidently, any tool that lets users filter data on page or drill down to greater detail qualifies as “analytics.” This isn’t wholly inaccurate since Webster’s dictionary defines analysis (the root of analytics) as: “Studying the nature of something or determining its essential features and their relations.”
“We should use labels to clarify not obscure meaning.”
But let’s get real. We should use labels to clarify not obscure meaning. Reporting tools have given users the ability to filter, sort, rank, and drill for years, and yet we never called them analytical tools. Instead, we’ve used the terms ad hoc query, end user reporting, dashboards, scorecards, and OLAP. To borrow a biblical phrase, let’s not put old wine into new wineskins. Otherwise, we simply spoil something good.
“Analytics is easy to say but hard to do.”
Let’s be clear: analytics is a natural progression of BI from reporting on historical activity to applying statistical techniques and algorithms to identify hidden patterns in large volumes of data. We can use these patterns and relationships to create models that help us understand customer and market dynamics and predict future events and behavior. Thus, analytics is a marked departure from traditional reporting in terms of scope, depth, and impact. It is easy to say but hard to do. This is why so many vendors have jumped on the analytics bandwagon without sporting any real credentials.
One of the few vendors that has marked a steady course in the usage of analytics is SAS. I talked with Keith Collins, SAS’ chief technology officer, last week about this issue, and all he could do is shake his head and commiserate about the bastardization of a term that is near and dear to his company’s heart. On the bright side, there could be worse things than for neophyte vendors to co-opt your semantics. Even if their current products don’t support honest-to-goodness analytics, their product roadmaps do.
In the big scheme of things, the bastardization of analytics is actually a bridge to the future. We use words to propel our thinking ahead as we prepare our bodies to follow. So, give it five or ten years and analytics will have a distinct meaning from reporting. By that time, I’m sure we’ll be bastardizing some new BI term.
Posted by Wayne Eckerson0 comments
How do you deliver dashboards that end users will adopt and use? That was the gist of the insightful and humorous presentation titled “Dashboards to Die For” delivered by John Rome, Associate Vice President in the Technology Office at Arizona State University (ASU), at TDWI’s BI Executive Summit in San Diego earlier this month.
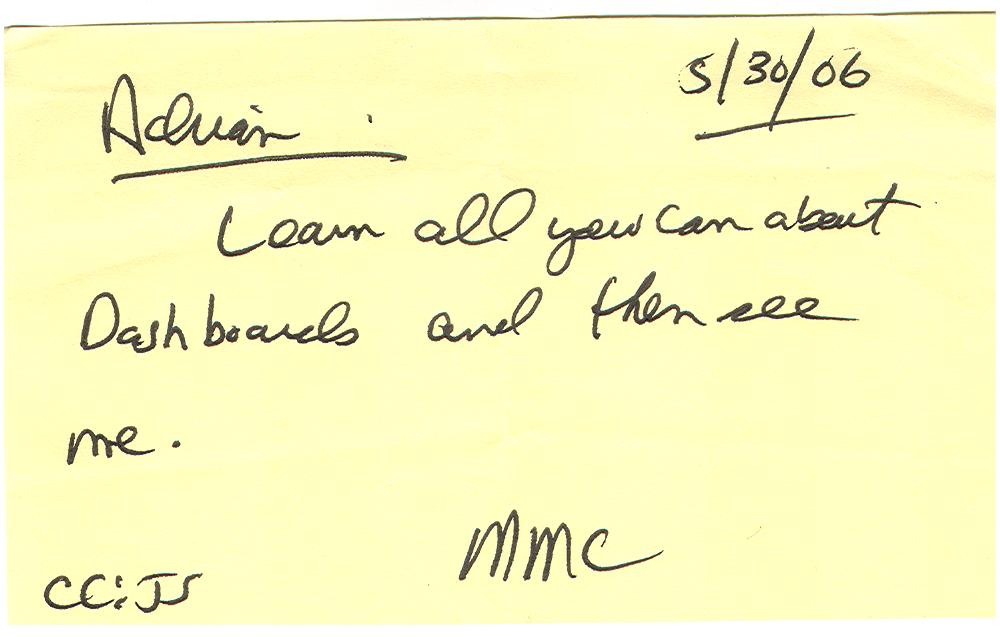
ASU’s dashboard project started with a memo from the University’s president to the CIO, Adrian Sannier, Rome’s boss, that said “Adrian, learn all you can about Dashboards and then see me.” (See figure 1.) With a data warehouse already in place, the dashboards would be instrumental in driving usage to higher levels, making BI pervasive, according to Rome.
Figure 1.
The data warehouse already contained most of the data so ASU only needed a flexible development tool and design principles to put the icing on the cake. It chose a dashboard tool from Corda Technologies which enabled it to create dashboards quickly by pulling data from any system, including the data warehouse. It then consulted a few dashboard and design experts, including Edward Tufte, Stephen Few, and yours truly.
Four years later, ASU has deployed dozens of dashboards in multiple departments and now has its own tips and techniques for delivering user-friendly and powerful dashboards. Here are a few of John’s recommendations:
<!--[if !supportLists]-->
- Embed dashboards as a link within the corporate portal so users have one click access to the information
- The best screen size for the dashboard window is 1024 x 768
- Place the most important elements for viewing in the upper left hand corner and the least important in the lower right corner to mimic the way the eye scans a page.
- Avoid decorative dashboard elements, like dials, gauges, and images and cluttering the screen with images and color.
- Design your dashboard pages to mimic popular Web layouts.
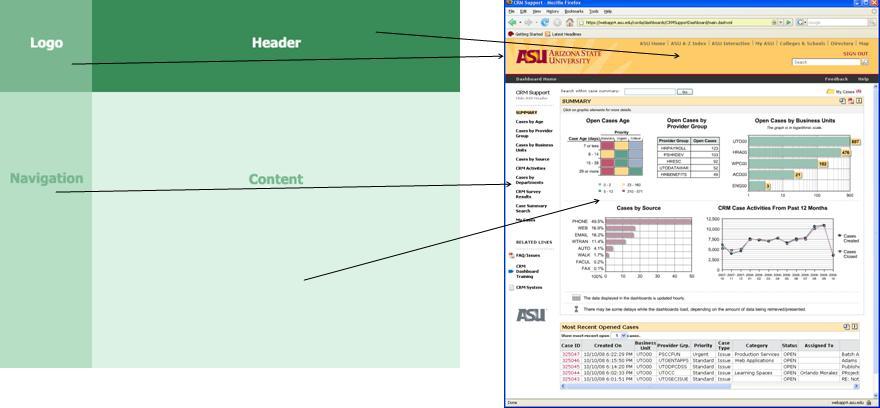
- Create a summary screen of the most important information. (See figure 2.)
Figure 2.
- Place elements on the screen so users don’t have to scroll.
- Add a “design tip” logo that users can click to get techniques about using the displayed elements and offer an online help center that provides a directory of topics for using the dashboards.
- Avoid pie charts, 3-D elements, and gradient shading.
- Accommodate color blindness.
- Accent key variables with subtle hues or patterns. See figure 3.
Figure 3. From
The Dashboard Spy. 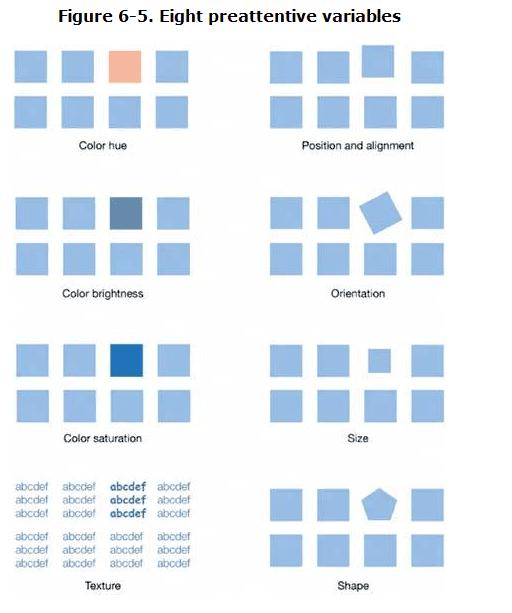
- My favorite: “Power comes with interaction/drills.”
- Make dashboards actionable. Here ASU has bidirectionally linked its dashboards to various operational systems, such as its PeopleSoft HR system, so authorized users can update the status of employees, classes, students, professors, etc.
- Use non-serif fonts and 12 point text for the main body and smaller fonts for supplementary text.
- Provide metadata about metrics, including SQL used. Offering screen cams and FAQs also helps.
- Use ranking to help users assess key elements within the data and to promote friendly competition among peer groups.
- Use charts rather than tables.
- Abbreviate numbers appropriately, so that $13,002,000 is $13M
- Perform usability studies to understand how users interact with the dashboard.
- Customize the dashboards by role.
Of all the design tips, the most powerful are to make the dashboards drillable, actionable, and instantly informative. ASU has put a lot of time and thought into the design and delivery of its dashboards and the effort has paid off. But don’t just take my word for it; check out ASU’s public dashboard Web site where you can get more information about the dashboards used at the University: http://dashboard.asu.edu.
Posted by Wayne Eckerson0 comments
The biggest mistake that I see companies make when purchasing BI tools is straddling the middle. In their quest to standardize on a single BI tool for reporting and analysis to achieve cost-savings and supplier simplification, they fail to meet the needs of any users. Typically, the tool is too powerful for casual users and not powerful enough for power users. Consequently, everybody loses and the BI program doesn’t get traction within the user community.
A Tool for Every Occasion. Although organizations need to standardize their BI architectures, it’s important to purchase multiple tools to meet the needs of different types of users. This is especially true for power users—business analysts, super users (ad hoc report developers), analytical modelers, and IT report developers—who perform a variety of tasks that involve true ad hoc access to data. Would you hire a carpenter to build an addition on your house if he only had a hammer in his toolbox? No, you would want a carpenter with a tool for every task to make his work more precise and efficient. The same is true for power users. The more tools the better.
Governance Needed. What’s more important to standardize than tools is the reports that power users publish for general consumption. This process needs to be controlled by a BI governance team that manages the list of “certified” reports used for corporate and departmental decision making. Although power users should be empowered to perform ad hoc analyses where data and reports do not exist, they should not be allowed to willy nilly create standardized, scheduled reports without approval from a BI governance team or report advisory board.
Ironically, the BI advisory board should be comprised of a cross-functional group of power users who have a vested interest in promoted business intelligence throughout the organization. Power users wield considerable influence in the successful outcomes of BI program. Getting them on your side by appointing them to BI advisory boards and empowering them with the tools they need is a key element in achieving BI success.
The Key to Standardization. After reading the above, you might think I’m against standardizing BI tools. I am not. Most organizations today are establishing standard toolsets for reporting, dashboarding, and advanced analytics. And today’s BI vendors offer robust suites of tools for every occasion so it’s easier than ever to standardize on a single vendor, if not a single toolset. Yet, most BI suites have weak spots and may not be as integrated as advertised. Most companies still pursue a best of breed strategy, often standardizing on toolsets from different vendors.
The point is that although tools standards are important, they pale in comparison to the need for standards to govern data and scheduled, interactive reports. Unfortunately, most BI governance programs focus on tools at the expense of delivering consistent information. So don’t get hung up on how many BI tools exist in your organization—especially when it comes to power users—more tools may actually be a sign of strength than weakness.
Posted by Wayne Eckerson0 comments
More than 70 business intelligence directors and sponsors gathered in San Diego this week for the TDWI’s semi-annual BI Executive Summit. The executives were enlightened by a mix of case studies (NetApp, Dell, Arizona State University, RBC Wealth Management, and ShareThis) and educational sessions on key areas of interest (BI in the Cloud, change management, cost estimating BI projects, Hadoop, visualization, BI mashups, social intelligence, pervasive BI, and the future of BI.)
The attendees also voted on technologies and programs that will be of key interest to them in the next three years. Topping the technology chart were predictive and in-database analytics, dashboards, visualization, the cloud, and operational BI. On the process side, key initiatives will be data quality and governance, business process management, and BI competency centers.
The event’s sponsors also chimed in during sessions and the future of BI panel. Teradata discussed active data warehousing, Information Builders showed how to integrate strategic, tactical, and operational BI, Birst discussed the benefits of cloud-based computing via its customer RBC Wealth, Sybase discussed in-database analytics via SQL-based plug-ins from Fuzzy Logix, and IBM discussed innovations in BI, such as search, collaboration, and mashups.
Most attendees valued the networking and collaboration that the event offers during lunch and breaks. In addition, hands-on workshops put the attendees in the drivers seat. During the Dell case study, attendees were given a real-life scenario of Dell’s data warehousing environment circa 2007 and then in groups had to decide how they would have approached the issues that Dell faced. After considerable discussion and debate, representatives from Dell—who were actively taking notes during the discussion phase—told the audience how they approached the situation. The workshop on change management also asked the attendees to work in small groups to discuss the implications of the FEE (fear, entitlement, earning.)
Quotable Quotes from the event:
- “You typically only need 12 metrics to run a company.” Tony Politano, consultant and author of Chief Performance Officer
- “Our dashboards, which are all built on the same platform and enterprise model, provide enterprise, functional, and role based views of information.” Dongyan Wang, NetApp
- “We designed the dashboard so that any user could get any information they want at any level of detail in three clicks.” Dongyan Wang, NetApp
- “A dashboard should provide more than composite views of information; they should allow users to create a personalized mashup via Web services and widgets so the environment caters to their needs.” Laura Edell Gibbons
- “Add a top 10 list to your portal to enhance usage and pay attention to principles of visual design.” John Rome, Arizona State University
- “We inventoried our spreadmarts and found we had about 40,000 around the world and that didn’t even count spreadsheets.” Rob Schmidt, Dell
- “It’s important to pick data governance decision makers at the right level; we had Michael Dell’s direct reports.” Mike Lampa, Dell
- “The initial response of the business units to the decision to shift analysts who spent most of their time creating reports into IT was ‘Go to hell!’ But quickly, the saw that the move would free up budget dollars and headcount for them and they bought into the decision.” Mike Lampa, Dell
- “One lesson learned [during the Dell DW renovation] was losing sight of the importance of delivering value while establishing and enforcing enterprise standards.” James Franklin, Dell
- “Our BI architectures are rooted in outdated assumptions of resource scarcity.” Mark Madsen, Third Nature
- “Because of advances in processing and storage power, we could now ship the data warehouse that I built in 1993 for $1.5 million on a laptop to every individual in the company.” Mark Madsen, Third Nature
Posted by Wayne Eckerson0 comments
Yesterday, I had doubts about the value of driving from Boston to New York (eight hours roundtrip) to attend a short IBM briefing on Smart Analytics, but thankfully IBM didn’t disappoint, at least in the end.
SPSS Acquisition
The Non Announcement. The briefing consisted of two announcements and one non-announcement.
The non-announcement was that IBM acquired leading analytics vendor, SPSS, for $1.2 billion. Oddly, the acquisition wasn’t the focus of the Smart Analytics briefing I was attending, as I assumed once I saw the press release. In fact, as I learned later, it was a coincidence that the SPSS announcement occurred on the same day as the Smart Analytics briefing. This was reinforced by the fact that the IBM software executives (Steve Mills and Ambuj Goyal) didn’t say much about the acquisition other than it would “embed the technology across our platform.” What I find strange about that statement is that IBM had a great data mining product called Intelligent Miner which it discontinued as a standalone product several years ago and embedded its functionality inside DB2 and other applications. So, they basically bought what they already had or still have. Odd.
Anyway, after five minutes discussing its head-turning non-announcement, IBM then turned to the real focus of the briefing, which was to announce the Smart Analytics System and the Smart Analytics Optimizer. The first is a new twist on an old yarn, but the second is potentially groundbreaking.
IBM Smart Analytics System
InfoSphere Redux? To understand the Smart Analytics System, you have to know what IBM means by analytics. To IBM, analytics is Cognos 8—which in reality is query, reporting, dashboarding, and some OLAP. It’s not data mining or predictive analytics (things that SPSS does), although I suspect that will evolve in short order.
What I gleaned in one-on-one meetings after the briefing (IBM briefings are traditionally long on concepts and short on details) is that the IBM Smart Analytics System is IBM Infosphere Balanced Warehouse done right, with Cognos 8 embedded as an optional add on. At least this is the first instantiation of the Smart Analytics System. Eventually, IBM will embed other components from its vast array of ever expanding software products into the Smart Analytics System, including presumably SPSS, as well as ETL, data quality, cubing, and archiving. It will also expand the platforms supported (beyond the IBM Power platform currently) and the number of high-end, out-of-box configurations (currently, based on data volumes: 4TB, 12TB, 25TB, 50TB, 100TB, and 200TB.) So from a systems perspective, it’s not all that new.
Radical Reworking. But from a customer and IBM perspective, Smart Analytics System represents a fundamental overhaul of how IBM goes to market and meets customer needs. For the first time, customers can purchase a vertically integrated IBM system—from hardware and software to tools and applications to consulting and support services—with a single SKU and have the system configured, tested, and shipped in as little as two weeks with a single point of contact for support. IBM will then periodically perform health checks to ensure performance still meets customer requirements.
Back to the Future. If you have some history in the high tech market, you might remember that this is similar to the way that IBM operated prior to the early 1990s. If you were an IBM customer then, you bought vertically integrated systems to run your core applications and were a “big Blue” shop through and through. But with the advent of Unix and open computing, IBM began losing market share, and to ward off financial ruin, it brought in CEO Lou Gerstner who decided to blow apart IBM’s business and systems models. To overcome the stigma of selling closed, proprietary systems in an open world, Gerstner created autonomous divisions for hardware, software, tools, and services and gave them permission—in fact exhorted them—to partner with all players, including fierce competitors of the other divisions. In short order, IBM consultants began recommending non-IBM hardware and software, DB2 began running on non-IBM hardware, and IBM hardware began running non-IBM chips, operating systems, and databases. And it worked financially, saving the company, but it came at a price.
Making IBM Easy to Do Business With. The price is that IBM has become increasingly difficult to do business with. In fact, from a customer perspective, IBM looks and feels like multiple companies rather than one. This increases the costs, complexity, time to value when deploying IBM solutions. To keep legendary IBM executive Tom Watson from rolling in his grave, IBM now is rediscovering its roots and providing vertically integrated systems and a single face to the customer. To do this, IBM is more closely aligning its product divisions, which is perhaps the biggest upshot of the announcement.
IBM’s attempts to reduce costs, complexity, and time to value through the Smart Analytics System resonated with a panel of IBM customers at the briefing. Ironically, none had implemented a Smart Analytics system or had even heard of it until the night before, but all said that it would have saved them a lot of time, money, and headaches. So IBM has rediscovered what worked prior to the 1990s (vertical integration), but without losing what has worked since (horizontal integration.) IBM will need this new hybrid model to compete in an increasingly competitive BI marketplace where established vendors and upstarts are shifting to selling vertically integrated solutions, some using open source and the cloud to radically alter the rules of the game.
Smart Analytics Optimizer
Purpose-Built Analytical Database? Perhaps the more interesting announcement was the Smart Analytics Optimizer, whose details I teased out in a one-on-one meeting with Arvind Krishna, vice president of enterprise information management products. I wanted to ask Arvind when IBM is going to get analytics religion and build or buy a purpose-built database optimized for query processing. But before I could, he rattled off a long list of limitations of traditional transaction databases when performing queries (e.g. ACID properties, logging, indexes, etc.) and the tradeoffs of new query processing architectures (e.g. in memory, columnar, cubes, parallelization, etc.) . He finished by saying, “What if we do it all? Only better?”
Well, that got my attention.
In Memory Sandbox. It turns out that Smart Analytics Optimizer, which will ship in Q4 for IBM Z mainframes, provides a super-fast query database inside a transaction processing system. The Optimizer lets you store a copy of highly trafficked query data in up to 1TB of main memory and uses compression, vector processing, and a proprietary IBM data format ("better than columnar" Arvind says) to accelerate query performance by a factor of 10 or more. From there, IBM’s cost-based optimizer knows whether to direct queries to the in-memory database or the transaction database to get the best performance. Today, IBM consultants will help companies figure out which data to allocate to memory but in the future this task will be automated.
Best of Both Worlds. If I heard Krishna right, then the Smart Analytics Optimizer gives customers the reliability and availability of a transaction system and the performance of a purpose-built query processing system—but all in one system. In other words, customers don’t need to offload queries from a transaction system or offload analytics from a data warehouse. They might only need one system for transactions and analytics! This saves plenty of dollars compared to offloading queries to a stand alone analytical system. Eventually, the Smart Analytics Optimizer will be ported to other IBM systems and support upwards of 50TB of main memory, Krishna says.
Last But Not Least. If what Krishna says is true, then IBM has figured out how to make an end-run around the spate of new analytic database vendors in the market today and finally has a response to Oracle’s Database Machine and Exadata Storage Server and Microsoft’s Project Gemini, both of which turbocharge their flagship database management systems with purpose-built analytical add ons.
Posted by Wayne Eckerson0 comments
“The enterprise software market is breaking down,” proclaimed Mark Madsen at a meeting of TDWI’s Boston Chapter yesterday. “And this opens the door for open source software.”
Madsen said the business model for enterprise software vendors has switched from selling licenses to selling maintenance and support. He said maintenance fees now comprise 45% of revenues and a lionshare of profitability. This is largely because the software market has matured and consolidated, leaving customers hostage to a few big companies, Madsen said.
Eager to echo this theme, Brian Gentile, CEO of open source BI vendor Jaspersoft, said the software market is ripe for disruption. “Oracle recently reported it delivered 51% margins for the quarter, yet I hear from countless senior executives that they can no longer afford their current software maintenance contracts and are looking for options.” Gentile said these executives often report that maintenance costs consume up to 80% of their IT budget.
(The TDWI Boston Chapter will make a copy of slides at its Web site shortly.)
As prices rise, IT executives are increasingly scrutinizing exactly what they are getting for their money. Many lament the “feature bloat” of enterprise software. “When I was a BI director,” said Madsen, “we used less than 40% of the features in our BI tools.” “And while open source products may not have all the bells and whistles, they pass the ‘good enough’ test,” said Madsen.
Will Interest Translate into Sales?
Not surprisingly, interest in open source BI tools has skyrocketed as the economy plummeted. Many BI teams are looking for ways to reduce costs while still delivering value. Speaking from the audience, Doug Newton, a data warehousing manager at the Mathworks and a coordinator for TDWI’s Boston Chapter, said that open source software makes it really easy to “kick the tires” before committing to a purchase. He told the audience that he downloaded open source software from Infobright, among others, and liked what he saw, although his company has yet to start using open source tools.
Evidently, Newton is not alone. Gentile says Jaspersoft averages 250,000 downloads a month for its free community edition and has had 9 million downloads since its inception six years ago. “Most aren’t paying us anything… yet,” says Gentile. Infobright, an open source columnar database vendor, which also presented at the event, says it has had 10,000 downloads since it's inception and expects that number to jump as more people hear about the company.
To date, there has been a lot more tire kicking than usage, although many experts (including myself) predict that that will gradually change. The TDWI chapter surveyed its users and found that 55% had yet to deploy open source software. Among those that have implemented open source BI tools, 35% have deployed MySQL, 20% Pentaho, 10% Jaspersoft, 6% BIRT, and 6% Talend. Their primary reason for deploying open source BI tools is cost (75%), followed by quick to deploy (30%) and unhappiness with their incumbent BI tools (14%).
Free Isn’t For Everyone
But not all lookers are hooked. Madsen said open source isn’t for everyone. “Just because it’s free, doesn’t mean it’s right for you.” Madsen said you still need to evaluate open source tools like any other BI tool. He said “missing features,” “lack of scalability,” “need for internal expertise” and “switching costs” are the biggest reasons why companies pass on open source tools.
Most open source BI vendors are small startups, which raises the question of vendor viability. Gentile deflected this issue by pointing to the rich community of developers that surrounds each open source product. “If Jaspersoft were to disappear tomorrow, our code would live on for a very long time because there is a strong developer community that has contributed to the code and is vested in its future.”
Leading Adopters
Small companies are leading the charge into open source BI, according to Madsen, but medium and large companies are not far behind. Small companies are deploying open source BI tools on an enterprise basis while large companies are using it in departmental pockets, usually to augment existing BI tools or fill a vacuum where no BI tools exist, Madsen says.
Kevin Haas, a partner at OpenBI, a BI consultancy that helps companies build applications with open source BI tools, says most of his clients use the free community edition of open source BI products. However, the clients with the biggest applications—those deployed on an enterprise scale—implement the commercial or premium version of the tools, which offer additional functionality for enterprise deployments as well as support, scheduled release cycles, and indemnity.
While adoption by end-user organizations is growing slowly, uptake by independent software vendors (ISVs) has been sizable. Open source makes it easy for ISVs to enrich their own applications by embedding open source reporting or analytical tools into their products. In fact, Gentile said hundreds of thousands of people are using Jaspersoft without knowing it because it’s embedded in other applications. The nascent market for software-as-a-service applications has been a particularly robust market for open source BI vendors.
Inexorable Rise
If the mantra of business today is “faster, better, cheaper” then it’s inevitable that companies need to explore alternatives to traditional enterprise software. Currently, open source BI tools offer significant cost savings over established BI vendors. As open source BI tools mature and continue to undercut established players on price and flexibility, we will see an inexorable rise in the adoption of open source BI tools.
Posted by Wayne Eckerson0 comments
Let’s face it. Most of our BI programs could use a little boost. Despite our best intentions, our BI programs aren’t getting the traction we (or our sponsors) anticipated. Performance is too slow or the data is suspect or we didn’t deliver exactly what users wanted. Or maybe, after years of disappointment, bungled communications, or cost overruns, the business simply doesn’t trust IT to do anything right.
If this describes your situation, it’s time for a quick win. You’re stuck in a perpetual negatively reinforcing loop and you need something dramatic—but quick and cheap—to get you and your team out of its rut. You need to do something that will bring a smile to their face and make them see you as an ally who can solve their problems. If your quick win succeeds, the business will shower you with money to fund more projects, including extensions to your data warehouse.
Of course, there is a catch. A quick win usually requires you to work outside of established platforms, processes, and procedures. While those things ensure that IT delivers stable, scalable solutions, they often impede quick action. A quick win often requires you to build something outside the existing architecture (especially if your existing data warehouse isn’t properly designed or supported.) As such, you need enough seniority or clout to bend the rules and make things happen.
This week I talked with a veteran BI director at a company who inherited a stalled data warehouse and a culture of distrust between business and IT. To gain credibility for the BI program and bridge the business-IT gulf, he sought a quick win. To scope his project, he met informally with business managers and executives to discuss their frustrations and needs. (As a former accountant he could “talk the talk” of business which helped immensely.) He learned that the company suffered from the “dueling spreadsheet” syndrome where executives from different departments couldn’t agree on basic sales numbers because they defined “product” differently. He got approval for a project that would track three “product” metrics through product development and launch. (Phase two will track product performance after launch.)
The project took six months from start to finish for approximately $75,000 (although this company doesn’t track costs for internally used resources. The solution enabled the company’s top executives for the first time to monitor a process that cut across departmental boundaries using standardized metrics. Needless to say, the solution was a big success and garnered the BI team much needed credibility. The caveat here is that he did not build the application on top of the existing data warehousing platform which has stringent change control processes which would have delayed deployment and increased costs. But with this quick win under his belt, the manager is now securing support and funding to overhaul the data warehouse. Eventually, he will retrofit the quick win application to run within the data warehousing environment.
The moral of the story is that a quick win can help build goodwill with the business and galvanize support that is needed to turn around a sagging data warehousing initiative. But to achieve a quick win, you often have to break the rules and work outside of standard architectures, processes, and procedures. If you are willing to take a risk, the rewards can be significant.
Posted by Wayne Eckerson0 comments
America’s biggest problem today is glut. The recession notwithstanding, we are saturated with stuff. I was heartened to read in the Wall Street Journal recently that supermarkets and discount retailers are cutting back on the number of items per category and brand that they carry. For example, Walgreen Co. is cutting back the number of superglues it carries from 25 to 11. Of course, 11 items is still an over-abundance but at least it’s a start.
We are also drowning in data. We’ve established personal coping mechanisms (or not) to deal with a never ceasing stream of email, direct mail, voice mail messages. But we are still vulnerable to the glut of metrics that our companies spit at us through an endless variety of reports. To cope, some largely ignore the data, making decisions based on gut instincts, while others pluck numbers from various reports and insert them into a personalized spreadsheet to do their analysis. Dashboards put a pretty face on metrics but often don’t do enough to slice through the tangle.
Strategy rolls down, and metrics roll up.
To deal with the glut of metrics, we need to take a step back and understand what we are trying to accomplish. Executives need to identify a handful of strategic objectives and devise metrics to measure progress against them. Each of these high-level metrics then cascades into additional metrics at each successive level of the organization. Each metric supports processes at an increasingly granular level and is tailored to a small number of employees who are accountable for its results. Activity at each level is then aggregated to deliver an enterprise view. In this way, strategy rolls down and metrics roll up.
The Power of One. So what is the right number of strategic metrics? One targeted metric may be all that is needed. British Airways reportedly turned itself around in the 1980s by focusing a single metric: the timely arrival and departure of airplanes. The CEO personally called any airport manager when a British Airways plane was delayed over a certain time to discover the reason for the hold up. The metric and the threat of a call from the CEO triggered a chain reaction of process improvements throughout the organization to ensure the event did not repeat itself.
Consequently, the airline reaped sizable benefits: it reduced costs involved in reaccommodating passengers who would have missed connecting flights and it avoided alienating those customers; it improved the moral of employees who no longer had to deal with angry or upset passengers; and it improved the performance of suppliers and partners who no longer had to rejigger schedules.
Ideally, employees each track about 3 to 7 metrics, each of which supports one or more high-level metrics. This is a reasonable number of manage and about the maximum number of things an individual can focus on effectively. More than that and the metrics lose their punch. Collectively, the organization may still have thousands of metrics it needs to track but all emanate from one—or more realistically about three to five strategic objectives which translate into 10 to 20 high-level metrics.
Thus, an effective dashboard strategy starts with defining strategic objectives and the metrics that support them. Dashboard designers should remember that less is more when creating performance metrics.
For more information on designing effective metrics, see Wayne’s report titled “Performance Management Strategies: How to Create and Deploy Effective Metrics.”
Posted by Wayne Eckerson0 comments
The BI/DW market has flowed quite independently for more than a decade, but increasingly it’s converging with other software streams, including ERP, MDM, search, and content management. This makes for an exciting, if not confusing, marketplace.
For example, what does BPM stand for? Business performance management or business process management? Well, technically it stands for both, but the identical acronyms have caused heartburn for those who have tried to evangelize, analyze, buy, or sell software in these two rapidly converging domains.
Helge Hess, SVP of Product and Solution Marketing at Germany-based IDS Scheer, shines a clear light on the space. He uses the term “process intelligence” to describe software that visualizes and analyzes how well business processes execute. I like the term. It reflects the growing convergence of process management and business intelligence yet creates a distinct identity for this emerging class of software.
For example, IDS Scheer’s ARIS Process Performance Manager, which shipped six years ago and is used by 300 customers, helps managers evaluate the performance of core processes and understand the root causes of highlighted problems and inefficiencies, according to Hess. (See figure 1.)
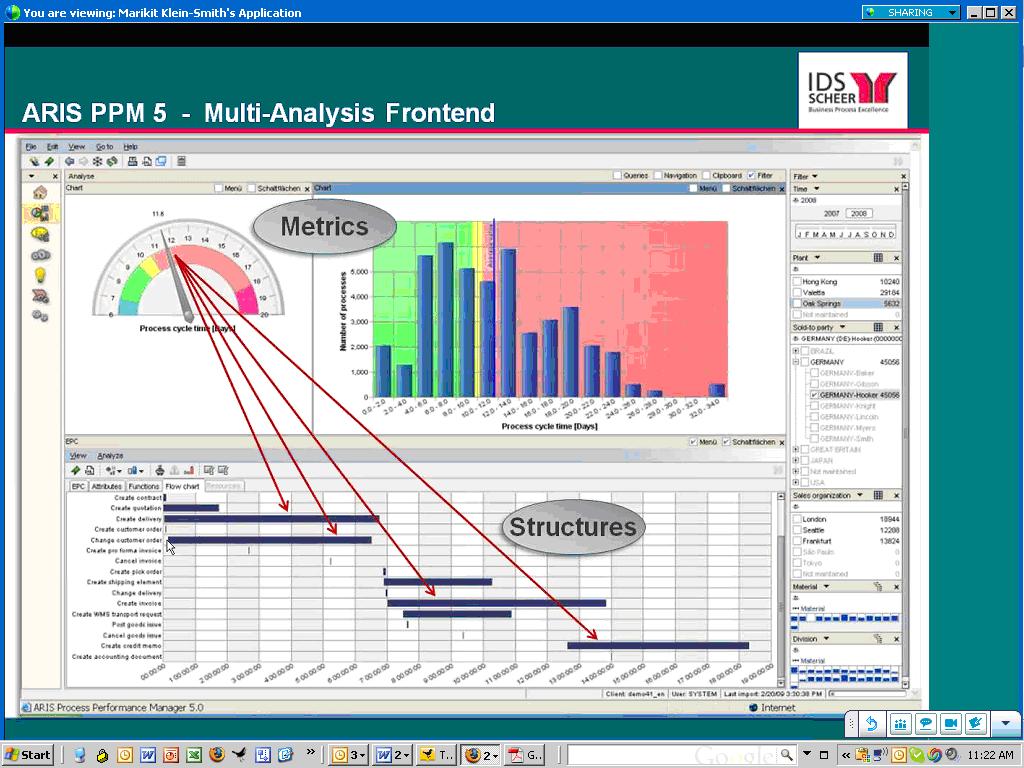
Figure 1. IDS Scheer’s ARIS Process Performance Manager lets users drill down from a performance metric in a dashboard to underlying process steps that caused the alert.
IDS Scheer partners with the big process management players (Oracle, SAP, Microsoft, and Tibco). For example, SAP resells ARIS PPM and Tibco OEMs it. While some partners offer process intelligence tools, Hess says its biggest competitors in this space are BI vendors. This is not because they offer process intelligence tools but because the IT department doesn’t want to purchase another “analytical” product unless it can eliminate other BI tools it already has through a standardization or consolidation program.
Selling into that kind of environment is challenging. Plus, mapping out business processes sounds like a nightmare and a potentially big inhibitor to doing deals. So I asked Hess to explain where his company has been most successful in selling ARIS PPM. He said the biggest market for the product is SAP customers who want to analyze “order-to-cash” and “procure-to-pay” processes within SAP’s sales and administration and procurement modules respectively. IDS Scheer offers a package for these two processes that come with predefined extraction routines for SAP content and analytical templates for displaying key process metrics. The packages reduce the complexity and time needed to map processes and deploy the tool.
“It takes five days to install and configure the packages” compared to 15 to 20 days for a custom implementation, says Hess. IDS Scheer also offers packages for human resources (“hire to retire” and recruitment), IT (incident management), accounting (billing), insurance (claims management) and banking (loans.) However, Hess was quick to point out that process mapping isn’t a time consuming nightmare. Evidently, ARIS PPM can automatically generate process workflows using sophisticated algorithms, which takes the pain out of mapping actual processes. I’ll have to see this to believe it!
Finally, Hess said that last year IDS Scheer augmented its nascent process intelligence portfolio by shipping a a product called ARIS Process Event Manager (PEM). Whereas ARIS PPM helps customers analyze and optimize processes, PEM monitors events so front-line workers can take action and close the loop. I’ve written about products like this in my research on operational BI. (Click here for a recent report.) Until recently, most companies needing such capabilities for fraud detection, stock market trading, or online recommendation engines have built it themselves. However, the off-the-shelf products from IDS Scheer, Altosoft, SeeWhy, and Coral8 (now Aleri) enable companies to save money and time when creating event-driven analytical applications.
Posted by Wayne Eckerson0 comments