I am in the process of collecting data for my TDWI Best Practices Report on predictive analytics. The report will look at trends and best practices for predictive analytics. Some specific issues being investigated in the survey include: Who is using predictive analytics? What skills are needed for it? Is it being used in big data analysis? Is it being used in the cloud? What kind of data is being used for predictive analytics? What infrastructure is supporting it? What is the value that people using it are getting from it? The survey is slated to run another week, so if you haven’t had the chance to take it yet, please do. Here is the link:
I define predictive analytics as a statistical or data mining solution consisting of algorithms and techniques that can be used on both structured or unstructured data (together or individually) to determine future outcomes. It can be deployed for prediction, optimization, forecasting, simulation, and many other uses.
One of the first questions I ask in the survey is, “What is the status of predictive analytics in your organization?” To date, 37% of the respondents are currently utilizing predictive analytics, 53% are exploring it, and less than 10% have no plans to use it. Please note that this survey is not meant to determine the adoption of predictive analytics. The group who answered the survey might have been self-selecting in that those who are not using predictive analytics may have chosen not to respond to the survey, at all. One reason I asked this question was to be able to look at any differences between the two groups.
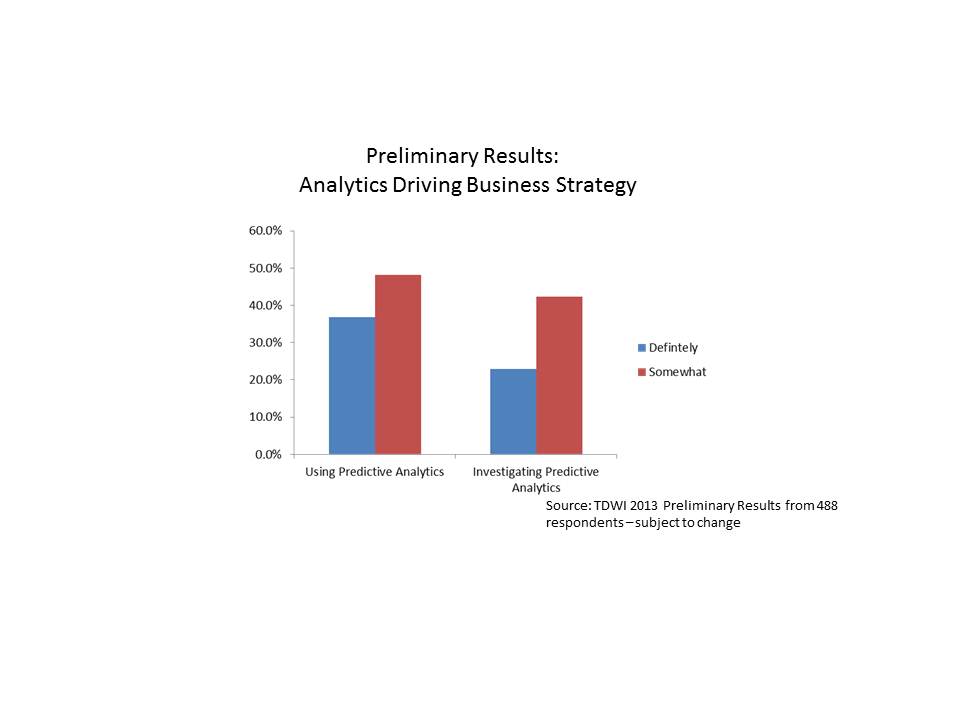
We asked the following question: “Would you say that analytics underpins your organization’s business strategy and drives day-to-day decisions?” The preliminary breakdown of responses is shown below.
Interestingly, those respondents who are already using predictive analytics were more likely to respond that analytics (in general) underpins their organization’s strategy and drives day-to-day decisions. About 37% of those respondents who are already using predictive analytics stated that analytics definitely underpins their day-to-day decision making, while only about 23% of those investigating the technology stated the same. Another way of looking at it is that 85% of those respondents using predictive analytics state that analytics is driving their day-to-day decisions in some way (i.e., answered definitely or somewhat), while only 65% of those who are investigating use analytics to drive day-to-day decisions and strategy.
Does this use of predictive analytics to drive strategy and decisions provide a benefit? It would appear so from preliminary results of the survey (of course subject to change). Close to 50% of the respondents who now use predictive analytics have actually measured a top or bottom line benefit or both from their predictive analytics efforts.
These preliminary results are quite interesting and I’m looking forward to getting all the data and analyzing the results! The TDWI Best Practices Report will be published later this year. I will continue to provide some updates here, along the way. So, stay tuned!
Posted by Fern Halper, Ph.D.0 comments
Good information and analytics are vital to enabling organizations of all stripes to survive tumultuous changes in the healthcare landscape. The latest issue of TDWI’s
What Works in Healthcare focuses on data-driven transformations in healthcare. I wrote an article for the issue that looks at some of the business intelligence and analytics issues surrounding the transition from a traditional, fee-for-service system to a value-based, “continuum of care” approach. One thing is clear: The importance of data and information integration as the fabric of this approach cannot be overstated.
A continuum (or “continuity”) of care is where a patient’s care experiences are connected across multiple providers: doctors, therapists, clinics, hospitals, pharmacies, and so on, including social programs. The traditional, fee-based approach has encouraged a disconnected experience for patients; visits to providers are mutually exclusive events and their patient data also lives in disparate silos. This disconnect increases the risk of patients getting the wrong treatments, taking medications improperly due to poor follow-up, or falling through the cracks entirely until there is an emergency. When patients only engage with healthcare when there is an emergency, costs go up. If there is poor follow-up after a hospital or emergency care visit, there is a greater likelihood that patients will have to be readmitted soon for the same problem.
Information integration plays a key role in the business model convergence that many experts envision as essential to improving care. “We see new partnerships or communities of care forming to improve collaboration across boundaries,” said Karen Parrish, IBM VP of Industry Solutions for the Public Sector during a recent conversation about IBM’s
Smarter Care. IBM’s ambitious program, announced in May, “enables new business and financial models that encourage interaction among government and social programs, healthcare practitioners and facilities, insurers, employers, life sciences companies and citizens themselves,” according to the company. Improving the continuum of a particular patient’s care among these participants will require good quality data and fewer barriers to the flow of information so that the right caregivers are involved, depending on the circumstances.
At the center of this information flow must be the patient. “Access to the unprecedented amount of data available today creates an opportunity for deeper insight and earlier intervention and engagement with the patient,” said Parrish. This includes unstructured data, such as doctor’s notes. In an insightful
interview with TDWI’s Linda Briggs, Ted Corbett, founder of Vizual Outcomes (and a speaker at the upcoming TDWI
BI Executive Summit in San Diego) points out that while unstructured data “houses some of the richest data in the hospital system…there is little consistency across providers in note format, which makes it difficult to access this rich store of information.”
To improve the speed and quality of unstructured data analysis, IBM puts forth its cognitive computing engine
Watson, which understands natural language. While Watson and cognitive computing are topics for another day, it’s clear that when we talk about information integration in healthcare, we have to remember that the vast majority of this information is unstructured. There will be increasing demand to apply machine learning and other computing power to draw intelligence from an integrated view of multiple sources of this information to improve patient care and treatment.
Posted by David Stodder0 comments
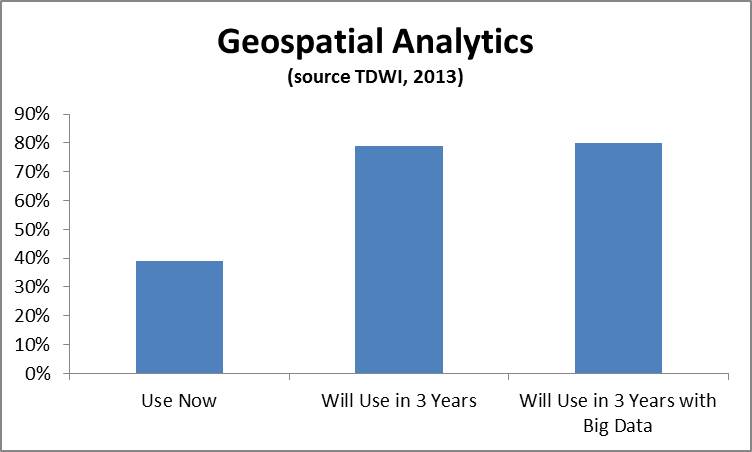
Geospatial data can be extremely powerful for a wide variety of use cases. Geospatial analysis – i.e. the practice of incorporating spatial characteristics in various kinds of analysis- has been incorporated in BI and visualization solutions for at least several years. Recently I’ve been hearing a lot from vendors about geospatial applications and using geospatial data in a range of more advanced analytics. In a recent TDWI technology survey, you can see that the geospatial analytics is growing in importance. We asked the respondents, “What kind of analytics are you currently using in your organization today to analyze data? In three years?” and “What kinds of techniques and tools is your organization using for big data analysis both today and in three years?” In the figure below, the 39% of respondents were currently using geospatial analysis and this number jumped to 79% in three years. The number of respondents answering affirmatively that geospatial analysis would be used in their big data solutions in three years was 81%.
Companies are becoming excited by the prospect of incorporating geospatial data into analysis. In terms of more advanced analytics, here are few examples of the kinds of analysis I’ve been hearing about:
- Predictive analytics. Geo-location data is being incorporated into predictive analytics. The most recent example of this is KXEN (www.kxen.com) announcing support for geo-location in its predictive analytics solution. KXEN will support data sources such as GPS, phone calls, machine sensors, geo-referenced signals, and social media. This includes capabilities for location-awareness, co-location, and path identification. For instance, marketers could use this kind of data to determine how likely someone is to purchase something at a store based on the path they took to get there (based on what others who took similar paths with a similar profile did) and offer a coupon based on this.
- Operational Intelligence. Operational intelligence incorporates analytics as part of a business process. Companies like Vitria (www.vitria.com) that provide operational intelligence solutions, support geospatial data. For instance, a wireless telephone company that monitors its network could use location data to determine which cell tower to fix based on where their high value customers are located.
- Situational Intelligence. Situational intelligence is a technique that integrates and correlates large volumes of multidimensional real time and historical data to identify and act on a problem. Part of that data is often geospatial For example, companies like Space Time Insight (www.spacetimeinsight.com) provide this kind of solution to help companies that deal with physical assets. Visualizing and analyzing this data can help answer questions like what happened, where did it happen, and why did it happen. Companies such as utility companies would use this information to a pinpoint problem and find the closest person to fix it.
I expect to hear a lot more about geospatial data and geospatial analysis moving forward. I’ll be writing more on the topic in the second half of 2013 and in 2014. Stay tuned.
Posted by Fern Halper, Ph.D.0 comments
Predictive analytics, a technology that has been around for decades has gotten a lot of attention over the past few years, and for good reason. Companies understand that looking in the rear-view mirror is not enough to remain competitive in the current economy. Today, adoption of predictive analytics is increasing for a number of reasons including a better understanding of the value of the technology, the availability of compute power, and the expanding toolset to make it happen. In fact, in a recent TDWI survey at our Chicago World Conference earlier this month, more than 50% of the respondents said that they planned to use predictive analytics in their organization over the next three years. The techniques for predictive analytics are being used on both traditional data sets as well as on big data.
Here are five trends that I’m seeing in predictive analytics:
- Ease of use. Whereas in the past, statisticians used some sort of scripting language to build a predictive model, vendors are now making their software easier to use. This includes hiding the complexity of the model building process and the data preparation process via the user interface. This is not a new trend but it is worth mentioning because it opens up predictive analytics to a wider audience such as marketing. For example, vendors such as Pitney Bowes, Pegasystems, and KXEN provide solutions targeted to marketing professionals with ease of use as a primary feature. The caveat here, of course, is that marketers still need the skills and judgment to make sure the software is used properly.
- Text hits the mainstream in predictive analytics. The kind of data being used as part of the predictive analytics process continues to grow in scope. For example, some companies are routinely using text data to improve the lift of their predictive models because it helps provide the “why” behind the “what”. Predictive analytics providers such as IBM and SAS provide text analytics as part of their solution. Others, such as Angoss and Pegasystems have partnered with text analytics vendors (such as Lexalytics and Attensity) to integrate this functionality in their products.
- Geospatial data use is on the rise. Geospatial data is also becoming more popular for use in and with predictive analytics. For instance, geospatial predictive analytics is being used to predict crime and terrorism. On the business front, location based data is starting to be used in conjunction with predictive modeling to target specific offers to customers based on where they are (i.e. traveling from work, at home) and their behavior.
- Operationalizing the analytics for action. Operationalizing means making something part of a business process. For example, companies are using predictive analytics to predict maintenance failures, predict collections, predict churn, and the list goes on. In these examples, predictive models are actually incorporated into the business process of an organization. For example, if a customer takes a certain action that puts them at risk for churn, that customer’s information is routed to the appropriate department for action. In fact, the term “action” and “insight to action” has come up quite a bit in recent conversations I’ve had with vendors.
- Adaptive learning: I’ve heard this go by a number of names – adaptive intelligence, automated learning, and adaptive learning. The idea is about continuously learning. For example, a model to understand behavior might be deployed against customer data. As the data changes, the model might change too. This kind prediction could also work against streaming data. Adaptive intelligence is still pretty early in the adoption cycle, but I expect it to increase.
These are just a few of the trends that I’m seeing in predictive analytics. As the technology continues to be adopted, new trends will certainly emerge. I used predictive analytics back in the late 1980s when I was at AT&T to understand customer behavior and I’m very happy to see that it’s a technology whose time has finally come! I’m now starting work on TDWI’s Best Practices Report on Predictive Analytics. Expect more from me on this topic in the future.
Posted by Fern Halper, Ph.D.0 comments
We are just weeks away from the
TDWI World Conference in Chicago (May 5-10), where the theme will be “Big Data Tipping Point.” I have it on good authority that by then, the current coldness will have passed and Chicago will be basking in beautiful spring weather. (If not, as they say, wait five minutes.) The theme of the World Conference is “Big Data Tipping Point,” which means that TDWI will feature many educational sessions to help you get beyond the big data hype and learn how to apply best practices and new technologies for conquering the challenges posed by rising data volumes and increased data variety.
I would like to highlight three sessions to be held at the conference that I see as important to this objective. The first actually does not have “big data” in its description but addresses what always appears in our research as a topmost concern: data integration. In many organizations, the biggest “big data” challenge is not so much about dealing with one large source as integrating many sources and performing analytics across them. Mark Peco will be teaching
“TDWI Data Integration Principles and Practices: Creating Information Unity from Data Disparity” on Monday, May 6.
On Wednesday, May 7, Dave Wells will head up
“TDWI Business Analytics: Exploration, Experimentation, and Discovery.” For most organizations, the central focus of big data thinking is about analytics; business leaders want to anchor decisions in sound data analysis and use data science practices to uncover new insights in trends, patterns, and correlations. Yet, understanding analytics techniques how to align them with business demands remains a barrier. Dave Wells does a great job of explaining analytics, how the practices relate to business intelligence, and how to bring the practices to bear to solve business problems.
The third session I’d like to spotlight is
“Building a Business Case for Big Data in Your Data Warehouse,” taught by Krish Krishnan. A critical starting point for big data projects and determining their relationship to the existing data warehouse is building the business case. Krish is great at helping professionals get the big picture and then see where to begin, so that you don’t get intimated by the scale. He will cover building the business case, the role of data scientists, and how next-generation business intelligence fits into the big data picture.
These are just three of the many sessions to be held during the week, on topics ranging from data mining, Hadoop, and social analytics to advanced data modeling and data virtualization. I hope you can attend the Chicago TDWI World Conference!
Posted by David Stodder0 comments
Happy New Year to the TDWI Community! As we head into 2013, it’s clear that organizations will continue to face unpredictable economic currents and regulatory pressures, and will require better intelligence and faster decision processes. TDWI has just published a new Best Practices Report that I wrote, “Achieving Greater Agility with Business Intelligence.” This report focuses on how organizations can develop and deploy BI, analytics, and data warehousing to improve flexibility and decision-making speed. I hope you can attend our upcoming Webinar presentation of the report, to be held on January 15, which will look in-depth at the research findings and offer best practices recommendations for increasing agility.
Three key areas of innovation in technologies and practices that I covered in the report will clearly be important as organizations aim for higher agility in 2013. These include the following:
Managed, self-service BI and analytic data discovery of structured and unstructured data: Decision makers are demanding tools that will allow them to access, analyze, profile, cleanse, transform, and share information without having to wait for IT. They will need access to more than just historical, structured data found in traditional systems. Unified access to both structured and unstructured data is growing in importance as decision makers seek to perform complete, context-rich analysis against big data.
New data warehousing and integration options, including virtualization: Data integration can be the source of challenging and expensive problems. Organizations are evaluating the range of options, including data federation and virtualization, that can give users managed self-service. These could allow users to work more iteratively with IT to create comprehensive views of data in place without having to physically extract and move it into an application, data mart, or specialized data store.
Agile development methods: The use of agile methods, now a mainstream trend in software development, is having an increasing impact on BI and data warehousing. Organizations are proving that they by implementing Scrum and other techniques, they can remove a good deal of the wait and waste of traditional development processes.
In the report, we found that most organizations regard their agility – that is, their ability to adjust to change and take advantage of emerging opportunities – and merely “average.” No doubt, organizations seeking new competitive advantages in 2013 will demand better than that. They will be looking to their BI, analytics, and data warehousing systems to help them become reach a higher level of agility.
Posted by David Stodder0 comments
By Philip Russom, TDWI Research Director
[
NOTE -- My new TDWI report about High-Performance Data Warehousing (HiPer DW) is finished and will be published in October. The report’s Webinar will broadcast on October 9, 2013. In the meantime, I’ll leak a few of the report’s findings in this blog series. Search Twitter for #HiPerDW to find other leaks. Enjoy!]
Data used to be just data. Now there’s big data, real-time data, multi-structured data, analytic data, and machine data. Likewise, user communities have swollen into thousands of concurrent users, reports, dashboards, scorecards, and analyses. The rising popularity of advanced analytics has driven up the number of power users, with their titanic ad hoc queries and analytic workloads. And there are still brave new worlds to explore, such as social media and sensor data.
The aggressive growth of data and attendant disciplines has piled additional stresses on the performance of systems for business intelligence (BI), data warehousing (DW), data integration (DI), and analytics. The stress, in turn, threatens new business practices that need these systems to handle bigger and faster workloads. Just think about modern analytic practices that depend on real-time data, namely operational BI, streaming analytics, just-in-time inventory, facility monitoring, price optimization, fraud detection, and mobile asset management. Many of the latest practices apply business analytics to leveraging big data, which is a performance double whammy of heavy analytic workloads and extreme scalability.
The good news for BI, DW, DI, and analytic practices is that solutions for high-performance are available today. These solutions involve a mix of vendor tools or platforms and user designs or optimizations. For example, the vendor community has recently delivered new types of database management systems, analytic tools, platforms, and tool features that greatly assist performance. And users continue to develop their skills for high-performance architectures and designs, plus tactical tweaking and tuning. This report [to be published in October 2013] refers this eclectic mix of vendor products and user practices as high-performance data warehousing (HiPer DW).
In most user organizations, a DW and similar databases bear much of the burden of performance; yet, the quest for speed and scale also applies to every layer of the complex BI/DW/DI and analytics technology stack, as well as processes that unfold across multiple layers. Hence, in this report, the term high-performance data warehousing (HiPer DW) encompasses performance characteristics, issues, and enablers across the entire technology stack and associated practices.
HiPer DW Solutions combine Vendor Functionality with User Optimizations
Performance goals are challenging to achieve. Luckily, many of today’s challenges are addressed by technical advancements in vendor tools and platforms.
For example, there are now multiple high-performance platform architectures available for data warehouses, including massively parallel processing (MPP), grids, clusters, server virtualization, clouds, and SaaS. For real-time data, databases and data integration tools are now much better at handling streaming big data, service buses, SOA, Web services, data federation, virtualization, and event processing. 64-bit computing has fueled an explosion of in-memory databases and in-memory analytic processing in user solutions; flash memory and solid-state drives will soon fuel even more innovative practices. Other performance enhancements have recently come from multi-core CPUs, appliances, columnar storage, high-availability features, Hadoop, MapReduce, and in-database analytics. Later sections of this report will discuss in detail how these and other innovations assist with high performance.
Vendor tools and platforms are indispensible, but HiPer DW still requires a fair amount of optimization by technical users. The best optimizations are those that are designed into the BI and analytic deliverables that users produce, such as queries, reports, data models, analytic models, interfaces, and jobs for extract, transform, and load (ETL). As we’ll see later in this report, successful user organizations have pre-determined standards, styles sheets, architectures, and designs that foster high performance and other desirable characteristics. Vendor tools and user standards together solve a lot of performance problems up front, but there’s still a need for the tactical tweaking and of tuning of user-built BI deliverables and analytic applications. Hence, team members with skills in SQL tuning and model tweaking remain very valuable.
Want more? Register for my HiPer DW Webinar, coming up Oct.9 noon ET:
http://bit.ly/HiPerDWwebinar
Posted by Philip Russom, Ph.D.0 comments
Personal, self-service analytics and discovery is one of the most important trends not only in business intelligence (BI) but in user applications generally. Expensive, monster systems that have big footprints and are not flexible to meet dynamic business needs are increasingly viewed by users as legacy. Rather than work with monolithic, one-size-fits-all applications that are dominated by IT management and development, users today want freedom and agility. They do not want to wait weeks or months for changes; they want to tailor reporting, analysis, and data sharing to their immediate and often changing needs.
I recently wrote a TDWI Checklist Report on this topic. The report offers seven steps toward personal, self-service BI and analytics success, from taking new approaches to gathering user requirements to implementing in-memory computing, visualization, and enterprise integration. I hope you find this Checklist Report useful in your BI and analytics technology evaluations and deployments.
An important conclusion in the report is that perhaps ironically, IT data management is absolutely critical to the success of personal, self-service analytics and discovery. Nowhere is this truer than with enterprise data integration. Business users often require a mix of different types of data, including structured, detailed data, aggregate or dimensional data, and semi-structured or unstructured content. In addition, given that it is doubtful that users will give up their spreadsheets any time soon, systems must be able to import and export data and analysis artifacts to and from spreadsheets. Assembling and orchestrating access to such diverse data sources must not be left up to nontechnical users.
Thus, even as users celebrate the trend toward personal, self-service analytics and discovery, its success hinges on IT’s data management prowess to ensure data quality, enterprise integration, security, availability, and ultimately, business agility with information.
Posted by David Stodder0 comments
At the recently concluded TDWI Solution Summit on big data analytics in San Diego, a discussion topic that percolated throughout the conference was the increasing role in IT purchases of the marketing function and chief marketing officers (CMOs). During a question-and-answer period, an attendee asked sponsor panel speakers for comment about a January 2012 projection by Gartner research vice president Laura McLellan that by 2017, CMOs will spend more on IT than CIOs. Though impressed by the projection, the panelists did not seem surprised by this trend.
Analytics adoption is driving major changes in marketing functions, which in most organizations are empowered with the responsibility for identifying, attracting, satisfying, and keeping customers. Marketing functions are becoming increasingly quantitative; they are replacing “gut feel” with data-driven decision making. Data drives the pursuit of efficiency and the achievement of measurable results. Marketing functions are key supporters of “data science,” which is the use of scientific methods on data to develop hypotheses and models and apply iterative, test-and-learn strategies to marketing campaigns and related initiatives.
In the new TDWI Best Practices Report I wrote, “Customer Analytics in the Age of Social Media” (to be published in early July), our survey found that in the majority of organizations (59%), IT and data management functions are still the owners of the budget for customer analytics technologies and services. TDWI did, however, discover a growing budget role played by marketing and advertising functions. Nearly two out of five (38%) respondents said that this function has responsibility for the customer analytics budget in their organizations. Executive management (39%) is also a significant player in budgetary decisions. (Note: “Big data analytics for better customer intelligence” is the theme of the next TDWI BI Executive Summit in San Diego.)
Whether located in IT or under the aegis of the corporate marketing function, specialists in customer analytics must often consult with globally distributed, departmental marketing teams as well as other business units to understand key business challenges and opportunities that should be considered in the development of models, algorithms, queries, and data files for analysis. In other words, customer analytics professionals must be able to live in both technology and business worlds and work with diverse teams from not only marketing, but also finance and operations, to develop accurate, consistent, and common metrics for evaluating results. The ability to move across functions is important for delivering holistic, or enterprise, benefits from customer analytics that go beyond marketing.
Customer analytics and the budget for analytic processes are often in the middle of tensions between IT and marketing. In interviews for this report, TDWI found that the growth in analytics implementation by marketing functions is putting stress on relations with IT over control of the data and who develops and runs analytic routines. The iterative, discovery-oriented qualities of predictive modeling and variable development don’t fit well with IT’s standard approach to gathering all user requirements at once and owning the development of a solution. “IT would ask us to identify the fields we wanted,” a marketing data analyst interviewed for the report said, “but we had to say, ‘Gee, we won’t know until we can look at what’s available and start playing with it.’”
Analytics is thus rising as a sensitive – and competitive – issue as marketing functions gain a larger share of organizations’ technology budgets. It is imperative, therefore, that CMOs and CIOs communicate effectively about shared customer analytics objectives to avoid letting internal budgetary battles become an obstacle to business success. Functioning in a complementary and collaborative fashion, marketing and IT functions can achieve more together than either could accomplish alone.
Posted by David Stodder0 comments
By Philip Russom, TDWI Research Director
High performance continues to intensify as a critical success factor for user implementations in data warehousing (DW), business intelligence (BI), data integration (DI), and analytics. Users are challenged by big data volumes, new and demanding analytic workloads, growing user communities, and business requirements for real-time operation. Vendor companies have responded with many new and improved products and functions for high performance—so many that it’s hard for users to grasp them all.
In other words, just about everything we do in DW, BI, DI, and analytics has some kind of high-performance requirement. Users want quick responses to their queries, analysts need to rescore analytic models as soon as possible, and some managers want to refresh their dashboards on demand. Then there’s scalability, as in the giant data volumes of big data, growing user communities, and the overnight refresh of thousands of reports and analyses. Other performance challenges come from the increasing adoption of advanced analytics, mixed workloads, streaming data, and real-time practices such as operational BI.
Across all these examples, you can see that high-performance data warehousing (HiPerDW) is all about achieving speed and scale, despite increasing complexity and concurrency. This applies to every layer of the complex BI/DW/DI technology stack, as well as processes that unfold across multiple layers.
Luckily, today’s high-performance challenges are being addressed by numerous technical advancements in vendor tools and platforms. For example, there are now multiple high-performance platform architectures available for your data warehouse, including MPP, grids, clusters, server virtualization, clouds, and SaaS. For real-time data, databases and data integration tools are now much better at handling streaming big data, service buses, SOA, Web services, data federation, virtualization, and event processing. 64-bit computing has fueled an explosion of in-memory databases and in-memory analytic processing in user solutions; flash memory and solid-state drives will soon fuel even more innovative practices. Other performance enhancements have recently come from multi-core CPUs, appliances, columnar storage, high-availability features, MapReduce, Hadoop, and in-database analytics.
My next Best Practices Report from TDWI will help users understand new business and technology requirements for high-performance data warehousing (HiPerDW), as well as the many options and solutions available to them. Obviously, performance doesn’t result solely from the data warehouse platform, so the report will also reach out to related platforms for analytics, BI, visualization, data integration, clouds, grids, appliances, data services, Hadoop, and so on. My upcoming TDWI report (to be published in October 2012) will provide tips and strategies for prioritizing your own adoption of high-performance features.
Please help me with the research for the HiPerDW report, by taking its survey, online at:
http://svy.mk/HiPerDW. And please forward this email to anyone you feel is appropriate, especially people who have experience implementing or optimizing the high performance of systems for BI/DW/DI and analytics. If you tweet about HiPerDW, please use the Twitter hash tag #HiPerDW. Thank you!
Posted by Philip Russom, Ph.D.0 comments