
Data Stories: Data Plus Music
A look through the music-related visualizations on Tableau’s user gallery.
- By Upside Staff
- September 11, 2019
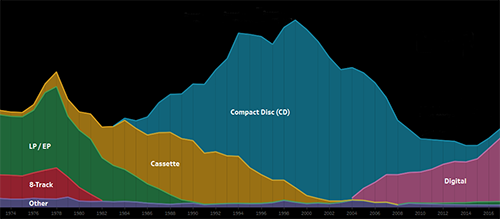
This data story describes the long-lasting effect Napster had on record sales and the recording industry as a whole.
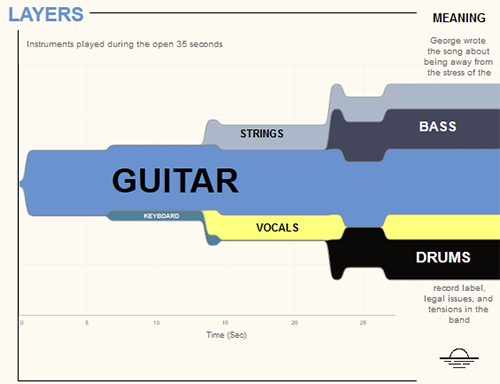
A song-by-song look at The Beatles’ last recorded album. (Set your screen zoom to 50% or less for best results.)
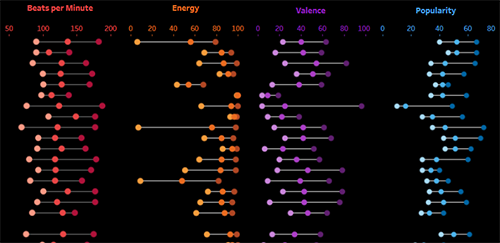
This chart breaks down Rolling Stone magazine’s top 100 greatest metal albums of all time by a range of key metrics.