Infographic | Data Visualization and Discovery
April 2, 2014
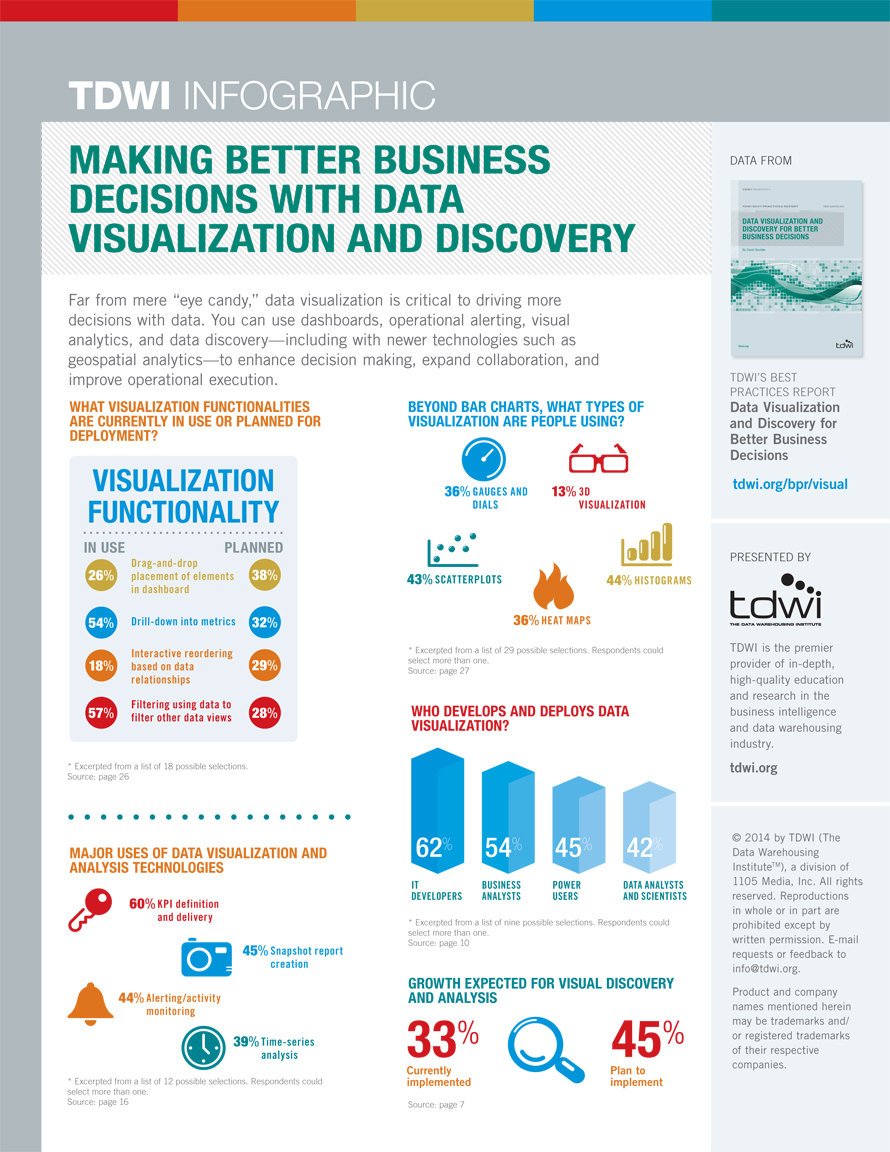
Far from mere “eye candy,” data visualization is critical to driving better business decisions with data. Learn the top visualization types, functionality, and development approaches for enhancing decisions, expanding collaboration, and improving operations.
Download the Infographic
Download the Best Practices Report
Share this infographic on your page! Just copy and paste the HTML below: