TDWI Best Practices Report | Data Visualization and Discovery for Better Business Decisions
July 1, 2013
This TDWI Best Practices Report focuses on how organizations can use data visualization, visual analytics, and data discovery to improve decision making, collaboration, and operational execution.
Graphical interaction with data is fast becoming the expected norm for the full spectrum of users, from executives to frontline personnel. Far from mere “eye candy,” data visualization is critical to fulfilling widely held goals for expanding organizations’ analytics culture and driving more decisions with data.
|
Visualization is a key concern for business intelligence and data analysis professionals because it affects how data is provisioned for users and the value they gain from it. In addition, visual data discovery has accelerated the transition toward easy-to-use, self-service visual analysis. As users interact with data visually, they see and then want to explore data relationships between and across standard business and demographic sources, and are increasingly likely to want to integrate non-relational sources such as geospatial data.
Good data visualization is critical to making smarter decisions and improving productivity; poorly created visualizations, on the other hand, can mislead users and make it more difficult for them to overcome the daily data onslaught. Users can lose confidence in their business intelligence (BI) systems if they are unable to understand or trust what they see.
The report provides analysis of an in-depth research survey and user stories to reveal current strategies and future plans for data visualization and analysis. It also offers recommendations for successfully evaluating and deploying data visualization, data discovery, and visual analysis technologies to achieve shorter time to insight for users across the enterprise. Download the report to learn more. |
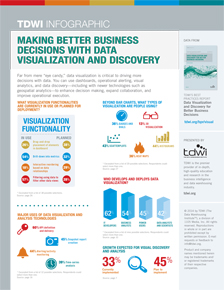
View the infographic
 |