Blog by Philip Russom
Research Director for Data Management, TDWI
To help you better understand what today’s emerging technologies and methods (ETMs) are – especially those related to business intelligence, analytics, and data warehousing – I’d like to share with you the series of 25 tweets I recently issued on the topic. I think you’ll find the tweets interesting, because they provide an overview of ETMs in a form that’s compact, yet amazingly comprehensive.
Each tweet below is a short sound bite or stat bite drawn from the recent TDWI report “Emerging Technologies for Business Intelligence, Analytics, and Data Warehousing,” which I researched and wrote with my colleagues David Stodder and Fern Halper. Many of the tweets focus on a statistic cited in the report, while other tweets are definitions stated in the report.
I left in the arcane acronyms, abbreviations, and incomplete sentences typical of tweets, because I think that all of you already know them or can figure them out. Even so, I deleted a few tiny URLs, hashtags, and repetitive phrases. I issued the tweets in groups, on related topics; so I’ve added some headings to this blog to show that organization. Otherwise, these are raw tweets.
Examples of Emerging Technologies and Methods (ETMs)
1. Most Emerging Techs & Methods (#ETMs) fall into 3 layers of BI, #analytics & #EDW tech stack.
2. #ETMs for #BI include #DataViz, #DataExploration, #DataPrep, #Dashboards, #MashUps, #MobileBI.
3. #ETMs for #Analytics operate on data from #SocialMedia, #IoT, streams, #MachineData.
4. #ETMs for #DataMgt include #Hadoop, #ApacheSpark, #NoSQL, in-DBMS #analytics, in-mem DBMS, columnar.
Examples of Emerging Methods and Platforms
5. #EmergingMethods include agile & lean dev methods applied to whole BI/DW/#analytics tech stack.
6. Other #EmergingMethods include #CompetencyCenters, #CollaborativeBI, #StoryTelling, #DataGovernance.
7. Emerging platforms include many types of clouds, #SaaS, #OpenSource, appliances...
The Importance of ETMs
8. #TDWI SURVEY SEZ: Emerging Techs & Methods (#ETMs) are very important (53%) or somewhat (39%).
9. #TDWI SURVEY SEZ: Emerging Techs & Methods (#ETMs) are opportunity to compete, evolve, perform (79%).
10. #TDWI SURVEY SEZ: Two-thirds of respondents (64%) already have #ETMs in production.
Benefits and Barriers for ETMs
11. #TDWI SURVEY SEZ: Top benefits of #ETMs = competitiveness, decision support, biz performance, innovation.
12. #TDWI SURVEY SEZ: Top barriers to #ETMs = LACK of skills, budgets, biz value, innovation.
13. #TDWI SURVEY SEZ: Other barriers to #ETMs = poor state of IT infrastructure & poor #DataGovernance.
User Satisfaction with Current State of ETMs
14. #TDWI SURVEY SEZ: 41% dissatisfied with their enterprise adoption of Emerging Techs & Methods (#ETMs).
15. Adoption of agile development methods is one of strongest trends in BI, #analytics, #EDW today.
16. #TDWI SURVEY SEZ: 55% dissatisfied with time required of development for BI, #analytics, #DataMgt.
User Success with Current State of ETMs
17. #TDWI SURVEY SEZ: Users successful with #ETMs for #SelfServiceBI (54%) & #DataPrep (50%).
18. #Hadoop & #NoSQL #ETMs are challenging for tools & apps built for relational data.
Emerging Data Types for Analytics
19. #TDWI SURVEY SEZ: 84% analyze structured data today. Suprising that 16% are not; maybe text analytics?
20. #TDWI SURVEY SEZ: #IoT data used by <20% of respondents today, but 40% more will use within 3 years.
21. Other data sources poised for growth = Machine data (sensors, devices) & #RealTime #EventStreaming.
22. #TDWI SURVEY SEZ: In clouds, users already do #EDW (35%), #Analytics (31%), sandbox (29%), DataInt (24%).
23. #TDWI SURVEY SEZ: 49% have production #PredictiveAnalytics today; another 39% will in 3 yrs.
ETMs for Data Warehousing & Data Management
24. #TDWI SURVEY SEZ: 3-yr hi growth in #DataMgt #ETMs = #RealTime, streams, #DataPrep, #Hadoop, #CloudDW.
25. Top security #ETMs for #DataMgt = #DataProtection (encrypt, mask, token), not just user name/pswd.
Want to learn more about Emerging Technologies and Methods (ETMs)?
For a more detailed discussion – in a traditional publication! – get the TDWI Best Practices Report, titled “Emerging Technologies for Business Intelligence, Analytics, and Data Warehousing,” which is available in a PDF file via a free download.
You can also register for and replay the TDWI Webinar, where David Stodder, Fern Halper, and I discuss the findings of the TDWI report.
Posted by Philip Russom, Ph.D.0 comments
By David Stodder, TDWI Director of Research for Business Intelligence
We are past the half-way point of 2015. Major League Baseball is celebrating its all-stars in Cincinnati as teams contemplate trades that they hope will make them stronger for the second-half run. Meanwhile, fall sports are starting to stir; National Football League teams open their training camps around the end of the month. Even pumpkin farmers are aware of time passing; to have fully grown pumpkins for Halloween, they need to have their seeds planted by now. While the air is warm and the sun isstill high in the sky, it’s a good time to contemplate significant trends in our industry this year.
The top trend on my list would be the flourishing of Apache Spark, the open source parallel processing framework (or “engine”) for developing analytic applications and systems working with big data. If Spark “went supernova in 2014,” as Stephen Swoyer put it in a fine article earlier this year, the energy from its explosion is forcefully generating a lot of industry activity in 2015. And not just among the small, newer vendors: IBM, Intel, Microsoft, and other mainstream vendors have issued major Spark announcements and product releases already this year, with more to come. Describing Spark’s potential impact, IBM experts have called Spark “the next Linux.”
As I learned at Strata in February and even more at the Spark Summit in June, Spark is shaking up the big data realm, whichhasbeen dominated by Hadoop, MapReduce, Hive, and Storm technologies. While compatible with them, Sparkoffers performance and scalability advantages over these technologies, including through support for multi-step pipelines that reduce the wait for steps to complete, and support for in-memory data sharing.
One of Spark’s most important attributes is a unified approach tothe management and interaction with a greater diversity of data. The Spark framework can support not only batch processing a la Hadoop but also interactive SQL, real-time processing, machine learning, and stream analytics. At Strata, I met with Matei Zaharia, CTO of Databricks, which was founded by Zaharia and other members of the University of California, Berkeley’s AMPLab team that created Spark and launched it as an Apache project. He did not envision organizations being satisfied with putting all their data into massive Hadoop data lakes; he saw instead increasing diversity in data sources that users seek to access, which requires the unified framework and processing layer that Spark provides.
Spark has changed the parameters of the debate about how SQL-based business intelligence and visual analytics tools and application users might access big data. With Spark SQL, one of the four primary AMPLab-developed libraries that fit into the Spark framework, organizations could bypass some of the steps that have been necessary to move and transform Hadoop files into data warehouses before they can fully analyze the data. Application programming interfaces, such as SparkR for R language programming, are broadening the toolkit available for analytics.
Spark is not as mature as Hadoop or the SQL-on-Hadoop offerings in the market. Spark is also not the only “star” in the open source interactive analytic SQL query galaxy; Presto, which is now strongly backed by Teradata, is another interesting distributed SQL query engine to watch. All of these technologies are enabling organizations to do broader and deeper analytics with data and are becoming important parts of emerging diverse, “hybrid” data architectures (pardon a shameless plug: this topic will be covered at our Solution Summit in Scottsdale later this year).
Spark is a major trend in 2015. What are other trends you are seeing? I would be interested to hear your thoughts.
Hyperlinks embedded in this blog:
Apache Spark: https://spark.apache.org/
Swoyer article: http://tdwi.org/articles/2015/01/06/apache-spark-next-big-thing.aspx
IBM announcement: https://www-03.ibm.com/press/us/en/pressrelease/47107.wss
Intel: https://software.intel.com/sites/campaigns/sparks/IgnitingSparks.php
Microsoft: http://azure.microsoft.com/blog/2015/07/10/interactive-analytics-on-big-data-with-the-release-of-spark-for-azure-hdinsight/
“the next Linux”: https://youtu.be/CrGB_2GJ-fA
Strata: http://strataconf.com/
Spark Summit: https://spark-summit.org/
Databricks: http://www.databricks.com/
AMPLab: https://amplab.cs.berkeley.edu/
Presto: https://prestodb.io/
Teradata Presto announcement: http://www.teradata.com/News-Releases/2015/Teradata-Launches-First-Enterprise-Support-for-Presto/?LangType=1033&LangSelect=true
Posted by David Stodder0 comments
TDWI just released my newest Checklist Report, Seven Considerations for Navigating Big Data Cloud Services. The report examines what enterprises should think about when evaluating the use of public cloud services to manage their big data. The cloud can play an important role in the big data world since horizontally expandable and optimized infrastructure can support the practical implementation of big data. In fact, there are a number of characteristics that make the cloud a fit for the big data ecosystem. Four of these include:
- Scalability. Scalability with regard to hardware refers to the ability to go from small to large amounts of processing power with the same architecture. The cloud can scale to large data volumes. Distributed computing, an integral part of the cloud model, works on a “divide and conquer” plan. So if you have huge volumes of data, they can be partitioned across cloud servers.
- Elasticity. Elasticity refers to the ability to expand or shrink computing resource demand in real time, based on need. This means that you have the potential to access as much of a service when you need it. This can be helpful for big data projects where you might need to expand the amount of computing resources you need to deal with the volume and velocity of the data.
- Resource pooling. Cloud architectures enable the efficient creation of groups of shared resources that make the cloud economically viable.
- Self-service. This refers to the ability of a user to run a set of cloud resources via a portal or browser interface. This is different than requesting it from your IT department.
For instance, you might want to use a public cloud to run your real-time predictive model against high volumes of data because you don’t want to use your own physical infrastructure to do so. Additionally, some companies are using the public cloud to explore big data, and then move certain information to the data warehouse. In effect, the cloud extends the data warehouse. There are numerous use cases emerging for big data in the cloud.
TDWI is starting to see an uptick in interest in the public cloud for BI and analytics. For example, in our recent quick survey of users who attended our Las Vegas World Conference, only about 25% of respondents said they would never use the public cloud for BI or analytics. The rest were either currently using the cloud (about 18%) or were actively looking into it or considering it as a possibility. We saw a similar response in a quick survey we did at our Boston conference in the fall of 2013. This will be an active area of research for TDWI this year, so stay tuned!
For more on big data in the cloud, also refer to Big Data for Dummies.
Posted by Fern Halper, Ph.D.0 comments
My new (and first!) TDWI Best Practices Report was published a few weeks ago. It is called Predictive Analytics for Business Advantage. In it, I use the results from an online survey together with some qualitative interviews to discuss the state of predictive analytics, where it is going, and some best practices to get there. You can find the report here. The Webinar on the topic can be found here.
There were many great questions during the Webinar and I’m sorry I didn’t get to answer them all. Interestingly, many of the questions were not about the technology; rather they were about how to convince the organization (and the senior executives) about the value in predictive analytics. This jives with what I saw in my research. For instance,”lack of understanding of predictive analytics” was cited as a key challenge for the discipline. Additionally, when we asked the question, “Where would you like to see improvements in your predictive analytics deployment?”, 70% of all respondents answered “education.” It’s not just about education regarding the technology. As one respondent said, “There is a lack of understanding of the business potential” for predictive analytics, as well.
Some of the questions from the audience during the Webinar echoed this sentiment. For instance, people asked, “How do I convince senior execs to utilize predictive analytics?” and “What’s the simple way to drive predictive analytics to senior executives?” and “How do we get key leaders to sponsor predictive analytics?”
There is really no silver bullet, but here are some ways to get started:
- Cite research: One way is to point to studies that have been done that quantify the value. For instance, in the Best Practices Report, 45% of the respondents who were currently using predictive analytics actually measured top- or bottom-line impact or both (see Figure 7 in the report). That’s pretty impressive. There are other studies out there as well. For instance, academic studies (i.e., Brynjolffson et al., 2011) point to the relationship between using data to make decisions and improved corporate performance. Industry studies by companies such as IBM suggest the same. Vendors also publish case studies, typically by industry, that highlight the value from certain technologies. These can all be useful fodder.
- Do a proof of concept: However, these can’t really stand alone. Many of the end users I spoke to regarding predictive analytics all pointed to doing some sort of proof of concept or proof of value project. These are generally small-scale projects with high business impact. The key is that there is a way to evaluate the impact of the project so you can show measurable results to your organization. As one respondent put it, “Limit what you do but make sure it has an impact.” Additionally, think through those metrics as you’re planning the proof of concept. Additionally, someone in the organization is also going to have to become the communicator/evangelist to get people in the organization excited rather than fearful of the technology. One person told me that he made appointments with executives to talk to them about predictive analytics and show them what it could do.
- BI foundation: Typically, organizations that are doing predictive analytics have some sort of solid BI infrastructure in place. They can build on that. For instance, one end user told me about how he built out trust and relationships by first establishing a solid BI foundation and making people comfortable with that and then introducing predictive analytics. Additionally, success breeds success. I’ve seen this countless times with various “new” technologies. Once one part of the organization sees something that works, they want it too. It grows from there.
- Grow it by acting on it: As one survey respondent put it, “Analytics is not a magic pill if the business process is not set up.” That means in order to grow and sustain an analytics effort, you need to be able to act on the analytics. Analytics in a vacuum doesn’t get you anywhere. So, another way to show value is to make it part of a business process. That means getting a number of people in the organization involved too.
The bottom line is that it is a rare company that can introduce predictive analytics, and behold! It succeeds quickly out of the gate. Are there examples? Sure. Is it the norm? Not really. Is predictive analytics still worth doing? Absolutely!
Do you have any suggestions about how to get executives and other members of your organization to value predictive analytics? Please let me know.
Posted by Fern Halper, Ph.D.0 comments
As my flight west from Orlando began its descent into San Francisco, I thought about how touching ground was a good metaphor for the just-completed TDWI World Conference. The theme of the conference was “Emerging Technologies 2014,” but one of my strongest impressions from the keynotes and sessions was the deflation of the hype surrounding those emerging technologies. Speakers addressed what’s new and exciting in business intelligence, big data, analytics, the “Internet of things,” data warehousing, and enterprise data management. However, they were careful to point out potential weaknesses in claims made by proponents of the new technologies and where spending on the new stuff just because it’s new could be an expensive mistake.
Setting the tone on Monday morning in their “Shiny Objects Show” keynote presentation, Marc Demarest and Mark Madsen debated pros and cons of new technologies, including cloud (the pursuit of “instant gratification”), in-memory computing, visualization, and Hadoop. Overall, they advised attendees to be wary of hype. “Strike out every adjective on the marketing collateral piece and see what’s left,” Demarest advised. The speakers were able to drill down to what are truly significant emerging trends, helping attendees focus on those instead of being distracted by the noise.
Evan Levy’s “Tipping the Sacred Cows of Data Warehousing” session was similarly educational. While deflating hype about various emerging technologies, Levy at the same time advised his audience to always question the value proposition of existing systems and practices to see if there might be a better way. He took particular aim at operational data stores (ODSs), noting that database and data integration technologies have matured to the point where maintaining an ODS is unnecessary.
I caught part of Cindi Howson’s session, “Cool BI: The Latest Innovations.” With guest appearances by some leading vendors to demo aspects of their products, the session covered promises and challenges inherent in several key emerging BI trends, including mobile BI, cloud BI, and visual data discovery. Cindi has just published the second edition of her book, Successful Business Intelligence, which offers a combination of interesting case studies and best practices advice to help organizations get BI projects off on the right foot and keep them going strong.
The Thursday keynote by Krish Krishnan and Fern Halper introduced TDWI’s Big Data Maturity Model Assessment Tool. Krish and Fern have been working on this project throughout 2013. It is a tool designed to help organizations assess their level of maturity across five dimensions important to realizing value from big data analytics: organization, infrastructure, data management, analytics, and governance. It is the first assessment tool of its kind. Taking such an assessment can help organizations look past the industry hype to gain a “grounded” view of where they are and what areas they need to address with better technologies and methods. Check it out!
Grounded: that’s where my plane is now, at SFO. Time to head home.
Posted by David Stodder0 comments
The Big Data Maturity Model and Assessment is set to launch on November 20th. Krish Krishnan and I have been working on this for a while, and we’re very excited about it.
As I mentioned in my previous blog post (see previous post, below), there are two parts to the Big Data Maturity Model and assessment tool. TDWI members will be getting an email about the assessment on November 20th. We urge you to take the assessment and see where you land relative to your peers regarding your big data efforts. Additionally, it’s important to note that we view this assessment as evolutionary. We know that many companies are in the early stages of their big data journey. Therefore, this assessment is meant to be evolutionary. You can come back and take it more than once. In addition, we will be adding best practices as we learn more about what companies are doing to succeed in their big data efforts.
In the course of our research for the model, Krish and I spoke to numerous companies embarking on big data. There were some patterns that emerged regarding how companies get started in their big data efforts. Here are a few of them:
- Large volumes of structured data are already being analyzed in the company. Some companies have amassed large volumes (i.e., terabytes) of structured data that they are storing in their data warehouse or in some sort of appliance, often on-premises. They feel that their BI infrastructure is pretty solid. Typically, the BI effort is departmental in scope. Some of these companies are already performing more advanced kinds of analysis; such as predictive analytics on the data. Often, they are doing this to understand their customers. The vision for big data is about augmenting the data they have with other forms of data (often text or geospatial data) to gain more insight.
- A specific need for big data. Some companies start a big data effort, almost from scratch, because of a specific business need. For instance, a wireless provider might be interested in monitoring the network and then predicting where failures will occur. An insurance company might be interested in telemetric information in order to determine pricing for certain kinds of drivers. A marketing department might be interested in analyzing social media data to determine brand reputation or as part of a marketing campaign. Typically these efforts are departmental in scope and are not part of a wider enterprise big data ecosystem.
- Building the business on big data. We spoke to many e-businesses that were building the business model on big data. While these companies might be somewhat advanced in terms of infrastructure to support big data often they were still working on the analytics related to the service and typically did not have any form of governance in place.
Remember to check your email!
Posted by Fern Halper, Ph.D.0 comments
We are getting ready to launch the TDWI Big Data Maturity Model and assessment tool in the next few weeks. We’re very excited about it, as it has taken a number of months and a lot of work to develop. There are two parts to the Big Data Maturity Model and assessment tool. The first is the actual TDWI Big Data Maturity Model Guide. This is a guide that walks you through the actual stages of maturity for big data initiatives and provides examples and characteristics of companies at different stages of maturity. In each of these stages, we look across various dimensions that are necessary for maturity. These include organizational issues, infrastructure, data management, analytics, and governance.
The second piece is the assessment tool. The tool allows respondents to answer a series of about 50 questions in the organization, infrastructure, data management, analytics, and governance dimensions. Once complete, the respondent receives a score in each dimension as well as some expectations and best practices for moving forward. A unique feature of the assessment is that respondents can actually look to see how their scores compare against their peers, by both industry and company size.
At the same time we’ve been building the Big Data Maturity Model, I’ve also been working on the predictive analytics Best Practices Report. Since no survey about analytics would be complete without some questions about big data, I did include a section about it in the survey. Interestingly, over 70% of the respondents actively using predictive analytics or planning to use it (242 respondents) from the survey claim to have some sort of big data push going on in their organization.
The group also reported a series a challenges (seen in the figure, below).
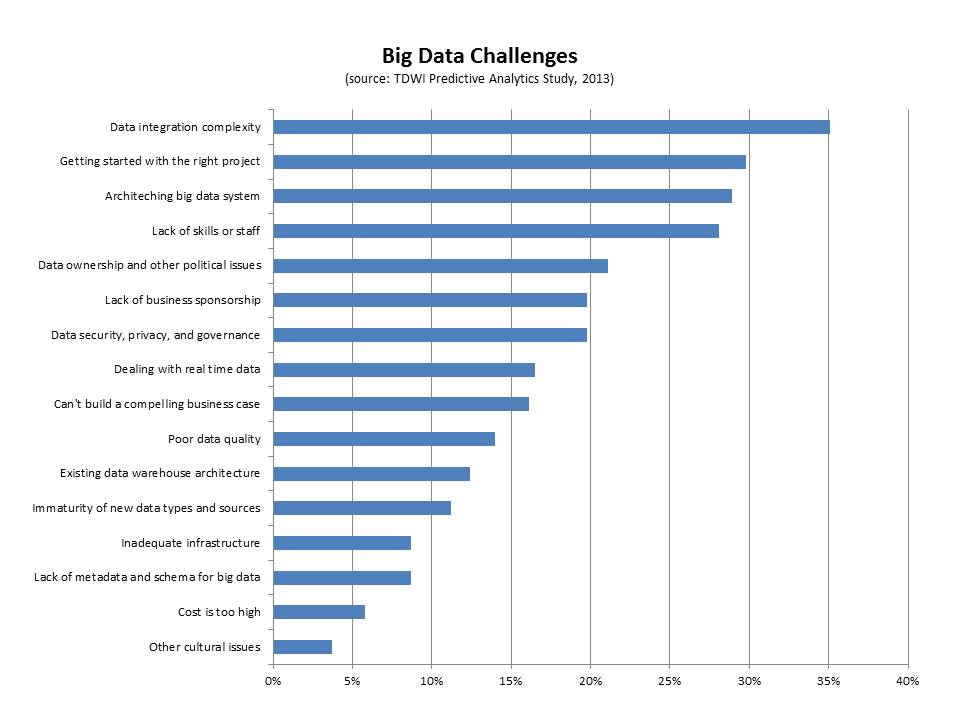
- Data integration. The top challenge cited by this group of respondents was big data integration (35%). Interestingly, if you look only at those respondents who are current users of predictive analytics and users of big data, 44% report this as the top challenge. Clearly, integrating disparate kinds of data from different sources is difficult. We saw this in our interviews for the big data maturity model. For instance, despite having some sort of data warehouse (especially in the case of the enterprise), a nascent organization in terms of big data maturity will often have also collected data as files with different formats, but without naming standards, and with storage structures that are minimally defined. This data is not integrated.
- Getting started with the right project. This is a key challenge that companies face when getting started with big data. Thirty percent of the respondents in this group cited it as a top challenge. We note this in the maturity model as well as a pre-adoption issue. Typically, there might be a team charged with exploring big data that is trying to determine the top business problems to solve. Identifying the right business problem is critical for success and business needs to get involved as quickly as possible.
- Architecting a big data system. Big data can mean disparate kinds of high-volume and high-frequency data. Architecting a system is important for success and it can be difficult. Twenty-nine percent of the respondents cited this as a challenge. The end goal for an architecture is frequently some sort of big data ecosystem that contains a unified information architecture which underpins analytics. Getting there can involve surgical precision in terms of rolling out infrastructure.
- Lack of skills or staff. Twenty-eight percent of respondents cited this as a top challenge. This is a key challenge, whether it is the skills for Hadoop or other big data infrastructure or the analytics skills required to make sense of big data. Different organizations approach the skills issue in different ways. Some hire externally or look for university hires. Others try to re-train from within. Still others look to cross-pollinate skills from one part of the organization to a team that utilizes new technologies. Some build centers of excellence that help with the training from within. Others form SWOT-type teams to address big data analytics.
Look out for e-mails and other materials over the next few weeks letting you know that the Big Data Maturity Model and assessment tool are live!
Posted by Fern Halper, Ph.D.0 comments
Treat them differently, if you want to get the most out of each.
By Philip Russom, TDWI Research Director for Data Management
I regularly get somewhat off-base questions from users who are in the thick of implementing or growing their analytic programs, and therefore get a bit carried away. Here’s a question I’ve heard a lot recently: “Our analytic applications generate so many insights that I should decommission my enterprise reporting platform, right?” And here’s a related question: “Should we implement Hadoop to replace our data warehouse and/or reporting platform?”
The common misconception I perceive behind these questions (which makes them “off-base” in my perception) is that people seem to be forgetting that analytics and reporting are two different practices. Analytics and reporting serve different user constituencies, produce different deliverables, prepare data differently, and support organizational goals differently. Despite a fair amount of overlap, I see analytics and reporting as complementary, which means you most likely need both and neither will replace the other. Furthermore, due to their differences, each has unique tool and data platform requirements that you need to satisfy, if you’re to get the most out of each.
Allow me to net it out with a few sweeping generalizations.
Reporting is mostly about entities and facts you know well, represented by highly polished data that you know well. And that data usually takes the form of carefully modeled and cleansed data with rich metadata and master data that’s managed in a data warehouse. In fact, it’s difficult to separate reporting and data warehouses, because most users designed their DWs first and foremost as a repository for reporting and similar practices such as OLAP, performance management, dashboards, and operational BI.
I regularly hear claims that Hadoop can replace a true DW. But I doubt this, because the current state of Hadoop cannot satisfy the data requirements of enterprise reporting near as well as the average DW can. Ultimately, it’s not about the warehouse per se; it’s about practices a DW supports well, such as reporting. I reserve the right to change my mind in the future, because Hadoop gets more sophisticated almost daily. My real point: most enterprise reporting depends on a DW for success, so keep and protect the DW.
Advanced analytics enables the discovery of new facts you didn’t know, based on the exploration and analysis of data that’s probably new to you. New data sources generally tell you new things, which is one reason organizations are analyzing big data more than ever before. Unlike the pristine data that reports operate on, advanced analytics works best with detailed source data in its original (even messy) form, using discovery oriented technologies, such as mining, statistics, predictive algorithms, and natural language processing. Sure, DWs can be expanded to support some forms of big data and advanced analytics. But the extreme volumes and diversity of big data are driving more and more users to locate big data on a platform besides a DW, such as Hadoop, DW appliances, or columnar databases.
I personally think that providing separate data platforms for reporting and analytics is a win-win data strategy. It frees up capacity on the DW, so it can continue growing and supporting enterprise reporting plus related practices. And it gives advanced analytics a data platform that’s more conducive to exploration and discovery than the average DW is.
Reporting is like a “high-volume business,” whereas analytics is like a “high-value business.” For example, with so-called enterprise business intelligence, thousands of concurrent report consumers access tens of thousands of reports that are refreshed nightly. By comparison, a small team of data analysts can transform an organization with a few high-value insights, such as new customer segments, visibility into costs, correlations between supplies and product quality, fraud detection, risk calculations, and so on. For completely different reasons, you need both reporting and analytics to serve the full range of user constituencies and provide many different levels of information and insight.
Most reports demand numeric precision, whereas most analyses don’t. Think financial reports (accurate to the penny) versus website page view reports (where guesstimates are fine).
Most enterprise reports require an audit trail, whereas few analyses do. Think regulatory reports versus the scores of an analytic model for customer churn.
Data management techniques differ. Squeaky clean report data demands elaborate data processing (for ETL, quality, metadata, master data, and so on), whereas preparing raw source data for analytics is simpler, though at higher levels of scale.
CONCLUSIONS: Despite some overlap, enterprise reporting and advanced analytics are so different as to be complementary. Hence, neither will replace the other. Both do important things for an information-driven organization, so you must give each what it needs for success, both at the tool level and at the data management level. Taking seriously the data requirements of big data analytics may lead you to implement Hadoop; but that doesn’t mean that Hadoop will replace a DW, which is still required to satisfy the data requirements of reporting and related practices, such as OLAP, performance management, dashboards, and operational BI.
Posted by Philip Russom, Ph.D.0 comments
We just concluded the
TDWI Big Data Analytics Solution Summit in Austin, Texas (September 15–17). It was a great success; many thanks go to our speakers, sponsors, TDWI colleagues who managed the event, and to everyone who attended. A special thanks to Krish Krishnan, who co-chaired the conference. We are already planning the 2014 Big Data Analytics Solution Summits to be held in the spring and fall, so keep an eye out for details on these events if you are interested in attending.
In Austin, I had the chance to talk with a broad range of attendees. Some were in the early stages of planning and technology acquisition for big data analytics, while others were in the middle of ongoing, funded projects involving enterprise data warehouses, analytic platforms, Hadoop, Hive, MapReduce, and related technologies. We had data scientists and BI and data warehouse architects in attendance as well as business and IT leadership.
I heard exciting tales of initiatives driven by C-level executives who were pushing hard to gain competitive advantages by infusing new business ventures with richer data insights about customer behavior, product and service affinity, and process optimization. It was clear that in the often confusing world of big data, where organizations are on a voyage of discovery, it is a major plus to have high-level leadership that can define objectives and desired outcomes.
Briefly, here are three takeaways from the Summit:
- Finding professionals with big data skills remains a huge challenge. In my introductory remarks at the Summit, I reported on results of our latest TDWI Technology Survey, which asked attendees at the August 2013 World Conference in San Diego to rank their big data challenges. The survey found that dealing with data variety and complexity is the biggest challenge right now, followed by data volume and data distribution. However, when I wrote the survey, I neglected to include finding skilled professionals among the challenges that attendees could rank. In conversations with Summit attendees, this was most often cited as their biggest challenge.
- Big data analytics is about speed. In both presentations and sponsor panel discussions, “speed” was cited numerous times as the chief benefit sought from big data analytic discovery. Organizations want faster speed to insight than they are getting from traditional BI and data warehousing systems; they know that if they can apply insights about customer behavior, marketing campaign performance, projected margins, and other concerns faster, they will save their organizations money and create business advantages. David Mariani, CEO of @Scale, Inc., and former VP of engineering at the social analytics data services provider Klout, gave a great presentation that brought into focus why Hadoop has been so valuable. Mariani discussed why emerging interactive query engines like Cloudera’s Impala and Apache Shark will change the game by adding significant speed-to-insight capabilities to the Hadoop environment.
- Integrating data views is essential to realizing big data value. Some of the most compelling case studies at the conference were about how organizations can build profitable ventures based on a foundation of integrated data analysis. Dr. Tao Wu, lead data scientist at Nokia’s Data and Analytics organization, offered a powerful case study presentation about Nokia’s HERE business. With a centralized analytics platform rather than disconnected silos, Nokia has been able to improve products by analyzing the combination of mobile and location data.
Posted by David Stodder0 comments
As I mentioned in my last blog post, I am in the process of gathering survey data for the TDWI Best Practices Report about predictive analytics. Right now, I'm in the data analysis phase. It turns out (not surprisingly) that one of the biggest barriers to adoption of predictive analytics is understanding how the technology works. Education is definitely needed as more advanced forms of analytics move out to less experienced users.
With regard to education, coincidentally I had the pleasure of speaking to Eric Siegel recently about his book, Predictive Analytics: The Power to Predict Who Will Click, Buy, Lie, or Die (www.thepredictionbook.com). Eric Siegel is well known in analytics circles. For those who haven’t read the book, it is a good read. It is business focused with some great examples of how predictive analytics is being used today.
Eric and I focused our discussion on one of the more technical chapters in the book that addresses the problem known as overfitting (aka overlearning)—an important concept in predictive analytics. Overfitting occurs when a model describes the noise or random error rather than the underlying relationship. In other words, it occurs when your data fits the model a little too well. As Eric put it, "Not understanding overfitting in predictive analytics is like driving a car without learning where the brake pedal is."
While all predictive modeling methods can overlearn, a decision tree is a good technique for intuitively seeing where overlearning can happen. The decision tree is one of the most popular types of predictive analytics techniques used today. This is because it is relatively easy to understand—even by the non-statistician—and ease of use is a top priority among end users and vendors alike.
Here's a simplified example of a decision tree. Let's say that you're a financial institution that is trying to understand the characteristics of customers who leave (i.e., defect or cancel). This means that your target variables are leave (yes) and don't leave (no). After (hopefully) visualizing or running some descriptive stats to get a sense of the data, and understanding the question being asked, the company puts together what's called a training set of data into a decision tree program. The training set is a subset of the overall data set in terms of number of observations. In this case it might consist of attributes like demographic and personal information about the customer, size of monthly deposits, how long the customer has been with the bank, how long the customer has used online banking, how often they contact the call center, and so on.
Here's what might come out:

The first node of the decision tree is total deposit/month. This decision tree is saying that if a customer deposits more than $4K per month and is using online bill pay for more than two years, they are not likely to leave (there would be probabilities associated with this). However, if they have used online banking for less than two years and contacted the call center X times, there may be a different outcome. This makes sense intuitively. A customer who has been with the bank a long time and is already doing a lot of online bill paying might not want to leave. Conversely, a customer who isn't doing a lot of deposits and who has made a lot of calls to the call center might be having trouble with the online bill pay. You can see that the tree could branch down and down, each branch with a different probability of an outcome, either yes or no.
Now, here's the point about overfitting. You can imagine that this decision tree could branch out bigger and bigger to a point where it could account for every case in the training data, including the noisy ones. For instance, a rule with a 97% probability might read, "If customer deposits more than $4K a month and has used online bill pay for more than two years, and lives in ZYX, and is greater than 6 feet tall, then they will leave." As Eric states in his book, "Overlearning is the pitfall of mistaking noise for information, assuming too much about what has been shown in the data." If you give the decision tree enough variables, there are going to be spurious predictions.
The way to detect the potential pitfall of overlearning is apply a set of test data to the model. The test data set is a "hold out"; sample. The idea is to see how well the rules perform with this new data. In the example above, there is a high probability that the spurious rule above won't pan out in the test set.
In practice, some software packages will do this work for you. They will automatically hold out the test sample before supplying you with the results. The tools will show you the results on the test data. However, not all do, so it is important to understand this principle. If you validate your model using hold-out data, then overfitting does not have to be a problem.
I want to mention one other point here about noisy data. With all the discussion in the media about big data, there has been a lot said about people being misled by noisy big data. As Eric notes, "If you checking 500K variables you'll have bad luck eventually—you'll find something spurious." However, chances are that this kind of misleading noise is from an individual correlation, not a model. There is a big difference. People tend to equate predictive analytics with big data analytics. The two are not synonymous.
Are there issues with any technique? Of course. That's why education is so important. However, there is a great deal to be gained from predictive analytics models, as more and more companies are discovering.
Posted by Fern Halper, Ph.D.0 comments