Let’s face it. Most of our BI programs could use a little boost. Despite our best intentions, our BI programs aren’t getting the traction we (or our sponsors) anticipated. Performance is too slow or the data is suspect or we didn’t deliver exactly what users wanted. Or maybe, after years of disappointment, bungled communications, or cost overruns, the business simply doesn’t trust IT to do anything right.
If this describes your situation, it’s time for a quick win. You’re stuck in a perpetual negatively reinforcing loop and you need something dramatic—but quick and cheap—to get you and your team out of its rut. You need to do something that will bring a smile to their face and make them see you as an ally who can solve their problems. If your quick win succeeds, the business will shower you with money to fund more projects, including extensions to your data warehouse.
Of course, there is a catch. A quick win usually requires you to work outside of established platforms, processes, and procedures. While those things ensure that IT delivers stable, scalable solutions, they often impede quick action. A quick win often requires you to build something outside the existing architecture (especially if your existing data warehouse isn’t properly designed or supported.) As such, you need enough seniority or clout to bend the rules and make things happen.
This week I talked with a veteran BI director at a company who inherited a stalled data warehouse and a culture of distrust between business and IT. To gain credibility for the BI program and bridge the business-IT gulf, he sought a quick win. To scope his project, he met informally with business managers and executives to discuss their frustrations and needs. (As a former accountant he could “talk the talk” of business which helped immensely.) He learned that the company suffered from the “dueling spreadsheet” syndrome where executives from different departments couldn’t agree on basic sales numbers because they defined “product” differently. He got approval for a project that would track three “product” metrics through product development and launch. (Phase two will track product performance after launch.)
The project took six months from start to finish for approximately $75,000 (although this company doesn’t track costs for internally used resources. The solution enabled the company’s top executives for the first time to monitor a process that cut across departmental boundaries using standardized metrics. Needless to say, the solution was a big success and garnered the BI team much needed credibility. The caveat here is that he did not build the application on top of the existing data warehousing platform which has stringent change control processes which would have delayed deployment and increased costs. But with this quick win under his belt, the manager is now securing support and funding to overhaul the data warehouse. Eventually, he will retrofit the quick win application to run within the data warehousing environment.
The moral of the story is that a quick win can help build goodwill with the business and galvanize support that is needed to turn around a sagging data warehousing initiative. But to achieve a quick win, you often have to break the rules and work outside of standard architectures, processes, and procedures. If you are willing to take a risk, the rewards can be significant.
Posted by Wayne Eckerson0 comments
While teaching a course on performance dashboards recently, I had a minor epiphany. The reason key performance indicators (KPIs) are so difficult to create is because you need a degree in sociology to predict the impact they will have on human and organizational behavior. My advice to the class was: Don’t try to design perfect KPIs on the first try; rather put them in play, see what behaviors they drive—both good and bad—and then adjust quickly.
Interpreting KPIs. The first challenge with KPIs is that without adequate training and socialization people will interpret results differently. For example, if a KPI’s status is red but its trend is positive, what should a user think? Perhaps, someone already spotted the problem and applied a remedy which is now working. Conversely, what if a KPI’s status is green but its trend is downward? A green light indicates performance is above average, but should you take action now before the green light turns yellow? Tools that let users annotate KPIs can help users take the right action and teach novices how the company works.
Driving Behavior. The second challenge with KPIs is using them to drive right behaviors. If we apply incentives to KPIs—such as attaching merit pay to performance measured by the KPIs—we in effect are conducting a giant sociology experiment. Since humans are irascible creatures embedded in complex (daresay dysfunctional) organizational systems, understanding the true impact of KPIs is impossible to predict.
The mistake most KPI teams make is focusing on one behavior at the expense of another that is outside their purview. For example, call center executives who want to boost productivity may create a metric that rewards agents for the number of calls taken per hour. Incented by this metric, agents will be tempted to terminate calls or transfer them to other departments without resolving them. This will have a dramatic affect customer satisfaction, which may be the responsibility of another team. Higher-level executives need to intervene and make sure a counterbalancing metric is introduced that rewards agents for both productivity and first-time call resolution.
KPI Ecosystems. KPI design teams need to think of KPI ecosystems. Although two metrics may conflict with each other by driving contradictory behavior, this is ok. In a strange way, this conflict empowers workers to make judicious decisions. Humans have a great capacity to live in and reconcile the tension between two opposites (although not without some anxiety.) With strong leadership and proper training, employees can effectively balance countervailing metrics.
Buy In. It’s also imperative that you get workers’ input before you implement incentive-based metrics. That’s because workers understand the nuances of the processes being measured and can identify whether the metrics are realistic and attainable and any potential loopholes that unscrupulous workers might exploit. Putting metrics out for broad-based review helps ensure the buy in of the people whose behavior you are trying to measure and change.
Defining KPIs is a sociology experiment and your workers are the test subjects. Treat them with respect, and your experiment has a better chance of success. But remember, it is an experiment, and if it fails, that’s part of the process. Refine the metrics and try again until you get it right.
For more information on designing effective metrics, see Wayne’s report titled “Performance Management Strategies: How to Create and Deploy Effective Metrics.”
Posted by Wayne Eckerson0 comments
America’s biggest problem today is glut. The recession notwithstanding, we are saturated with stuff. I was heartened to read in the Wall Street Journal recently that supermarkets and discount retailers are cutting back on the number of items per category and brand that they carry. For example, Walgreen Co. is cutting back the number of superglues it carries from 25 to 11. Of course, 11 items is still an over-abundance but at least it’s a start.
We are also drowning in data. We’ve established personal coping mechanisms (or not) to deal with a never ceasing stream of email, direct mail, voice mail messages. But we are still vulnerable to the glut of metrics that our companies spit at us through an endless variety of reports. To cope, some largely ignore the data, making decisions based on gut instincts, while others pluck numbers from various reports and insert them into a personalized spreadsheet to do their analysis. Dashboards put a pretty face on metrics but often don’t do enough to slice through the tangle.
Strategy rolls down, and metrics roll up.
To deal with the glut of metrics, we need to take a step back and understand what we are trying to accomplish. Executives need to identify a handful of strategic objectives and devise metrics to measure progress against them. Each of these high-level metrics then cascades into additional metrics at each successive level of the organization. Each metric supports processes at an increasingly granular level and is tailored to a small number of employees who are accountable for its results. Activity at each level is then aggregated to deliver an enterprise view. In this way, strategy rolls down and metrics roll up.
The Power of One. So what is the right number of strategic metrics? One targeted metric may be all that is needed. British Airways reportedly turned itself around in the 1980s by focusing a single metric: the timely arrival and departure of airplanes. The CEO personally called any airport manager when a British Airways plane was delayed over a certain time to discover the reason for the hold up. The metric and the threat of a call from the CEO triggered a chain reaction of process improvements throughout the organization to ensure the event did not repeat itself.
Consequently, the airline reaped sizable benefits: it reduced costs involved in reaccommodating passengers who would have missed connecting flights and it avoided alienating those customers; it improved the moral of employees who no longer had to deal with angry or upset passengers; and it improved the performance of suppliers and partners who no longer had to rejigger schedules.
Ideally, employees each track about 3 to 7 metrics, each of which supports one or more high-level metrics. This is a reasonable number of manage and about the maximum number of things an individual can focus on effectively. More than that and the metrics lose their punch. Collectively, the organization may still have thousands of metrics it needs to track but all emanate from one—or more realistically about three to five strategic objectives which translate into 10 to 20 high-level metrics.
Thus, an effective dashboard strategy starts with defining strategic objectives and the metrics that support them. Dashboard designers should remember that less is more when creating performance metrics.
For more information on designing effective metrics, see Wayne’s report titled “Performance Management Strategies: How to Create and Deploy Effective Metrics.”
Posted by Wayne Eckerson0 comments
The BI/DW market has flowed quite independently for more than a decade, but increasingly it’s converging with other software streams, including ERP, MDM, search, and content management. This makes for an exciting, if not confusing, marketplace.
For example, what does BPM stand for? Business performance management or business process management? Well, technically it stands for both, but the identical acronyms have caused heartburn for those who have tried to evangelize, analyze, buy, or sell software in these two rapidly converging domains.
Helge Hess, SVP of Product and Solution Marketing at Germany-based IDS Scheer, shines a clear light on the space. He uses the term “process intelligence” to describe software that visualizes and analyzes how well business processes execute. I like the term. It reflects the growing convergence of process management and business intelligence yet creates a distinct identity for this emerging class of software.
For example, IDS Scheer’s ARIS Process Performance Manager, which shipped six years ago and is used by 300 customers, helps managers evaluate the performance of core processes and understand the root causes of highlighted problems and inefficiencies, according to Hess. (See figure 1.)
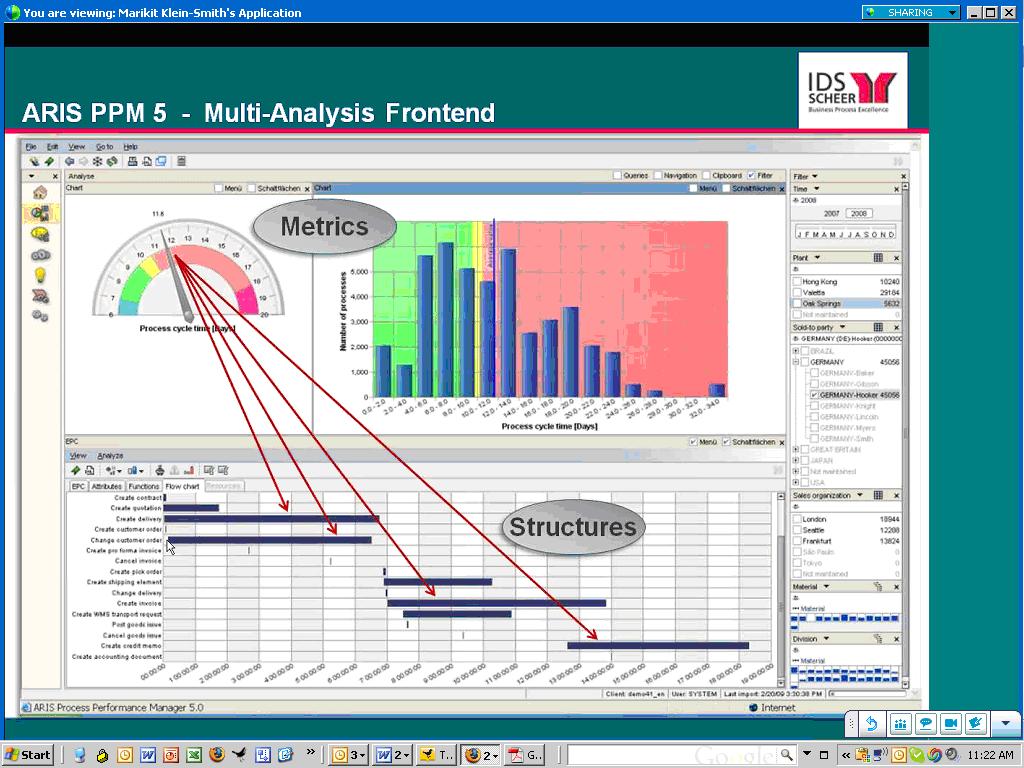
Figure 1. IDS Scheer’s ARIS Process Performance Manager lets users drill down from a performance metric in a dashboard to underlying process steps that caused the alert.
IDS Scheer partners with the big process management players (Oracle, SAP, Microsoft, and Tibco). For example, SAP resells ARIS PPM and Tibco OEMs it. While some partners offer process intelligence tools, Hess says its biggest competitors in this space are BI vendors. This is not because they offer process intelligence tools but because the IT department doesn’t want to purchase another “analytical” product unless it can eliminate other BI tools it already has through a standardization or consolidation program.
Selling into that kind of environment is challenging. Plus, mapping out business processes sounds like a nightmare and a potentially big inhibitor to doing deals. So I asked Hess to explain where his company has been most successful in selling ARIS PPM. He said the biggest market for the product is SAP customers who want to analyze “order-to-cash” and “procure-to-pay” processes within SAP’s sales and administration and procurement modules respectively. IDS Scheer offers a package for these two processes that come with predefined extraction routines for SAP content and analytical templates for displaying key process metrics. The packages reduce the complexity and time needed to map processes and deploy the tool.
“It takes five days to install and configure the packages” compared to 15 to 20 days for a custom implementation, says Hess. IDS Scheer also offers packages for human resources (“hire to retire” and recruitment), IT (incident management), accounting (billing), insurance (claims management) and banking (loans.) However, Hess was quick to point out that process mapping isn’t a time consuming nightmare. Evidently, ARIS PPM can automatically generate process workflows using sophisticated algorithms, which takes the pain out of mapping actual processes. I’ll have to see this to believe it!
Finally, Hess said that last year IDS Scheer augmented its nascent process intelligence portfolio by shipping a a product called ARIS Process Event Manager (PEM). Whereas ARIS PPM helps customers analyze and optimize processes, PEM monitors events so front-line workers can take action and close the loop. I’ve written about products like this in my research on operational BI. (Click here for a recent report.) Until recently, most companies needing such capabilities for fraud detection, stock market trading, or online recommendation engines have built it themselves. However, the off-the-shelf products from IDS Scheer, Altosoft, SeeWhy, and Coral8 (now Aleri) enable companies to save money and time when creating event-driven analytical applications.
Posted by Wayne Eckerson0 comments
Cloud computing offers a lot of promise. By virtualizing hardware and software infrastructure and paying a third party to deliver services as you go on a subscription or usage basis, companies can save a lot of money and time, and speed the deployment of business solutions.
Initially, cloud-based solutions were designed for small- to mid-size companies that didn’t have available IT resources or capital to spend on creating and managing a software and hardware infrastructure. Today, many large companies are investigating the cloud as a way to add new business solutions quickly and augment existing data center capacity. But cloud computing isn’t for everyone, especially in the BI space.
Types of Cloud Offerings
To understand what makes sense to deploy in the cloud, you first have to fathom what the cloud does. In essence, the cloud abstracts underlying services and is a common metaphor for the Internet, which routes data dynamically across a global network based on capacity and other factors. Today’s cloud delivers three levels of services that together comprise a solutions stack: applications, platforms, and infrastructure services. (See figure 1.)
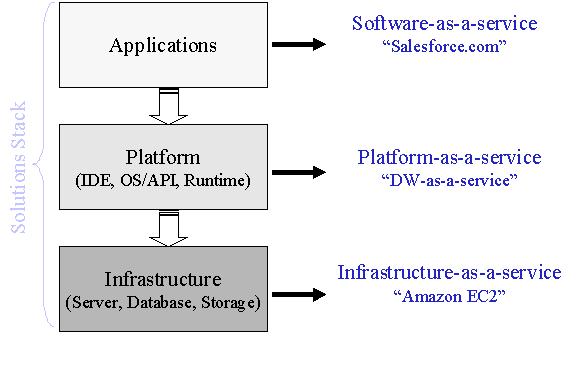
SaaS. Application services are typically called software-as-a-service (SaaS). Salesforce.com, which was founded in 1999 to deliver sales solutions online to small- and mid-sized companies, popularized the notion of SaaS. Salesforce.com now boasts 1.1 million subscribers and has spawned lots of imitators. With SaaS, employees use a browser to access an online application, which is housed and managed by the SaaS provider. There is no hardware to configure or software to install and no licenses to purchase. You simply pay a monthly subscription fee for each user, and you’re up and running.
IaaS and PaaS. In the past several years, the cloud industry has grown, spawning two more services: platform as a service (PaaS) and infrastructure as a service (IaaS). Amazon popularized the latter with the advent of its EC2 cloud computing offering, which lets IT administrators dynamically provision servers in Amazon’s data center and pay according to usage. Many IT administrators now use IaaS as a convenient, low-cost way to maintain development, test, or prototyping environments or to support analytic sandboxes that have a short lifespan. PaaS is the newest addition to the cloud family, allowing developers to build and deploy custom cloud-based applications and solutions. Many PaaS customers are ISVs that want to create cloud-based offerings or enhance them with complementary applications, such as reporting or analysis.
BI in the Cloud
From a BI perspective, all three incarnations of the cloud offer interesting possibilities, but come with constraints. For instance, SaaS offerings are essentially packaged analytic applications. Like their on premises brethren, SaaS offerings need to be highly tailored to an application domain so the solution fits the customer requirements like a glove and doesn’t require endless and unprofitable rounds of customization. And it doesn’t do much good if the SaaS vendor only supports one application out of several because the customer then will end up with a mix of on premise and hosted solutions that are difficult to integrate. So, unless the SaaS vendor supports a broad range of integrated functional applications, it’s hard to justify purchasing any SaaS application.
Data Transfers. Another constraint is that all three types of BI cloud offerings need to transfer data from an internal data center to the cloud. Most BI solutions query a data warehouse or data mart that is continuously loaded from operational systems residing in the company’s data center. Currently, moving large volumes of data on a regular basis to the cloud over the public internet injects latency and complexity into the load process and can become expensive since cloud providers charge fees for data transfers and data storage. In addition, users that query cloud-based data marts using BI tools that run on inhouse servers, then their queries and result sets also travel across the internet, adding more latency and cost.
Given this constraint, BI cloud-based solutions are ideal in the following situations:
- Small companies that don’t have a lot of data.
- Applications that don’t require lots of data, such as development and test environments or small data marts that can be updated quickly.
- Applications in which all source data already exists in the cloud (e.g. Salesforce.com or a start-up company that runs its entire business in the cloud.
- Ad hoc analyses that require one-time import of data from one or more sources. The cloud is proving an ideal way to support data-hungry analysts.
- Report sharing
Data security. Data security is another constraint, but one that is largely illusory. Companies are reluctant to move data outside of the corporate firewall for fear that it might get lost or stolen. Highly publicized data thefts in recent years certainly feed this sentiment. But the fear is largely irrational. Most companies already outsource sensitive data to third party processors, including payroll (e.g. ADP) and customer and sales data (e.g. Salesforce). And when IT administrators examine the data center and application level security supported by cloud vendors, most will say that the data is probably more secure in these data centers than their own! Most new technologies encounter the same criticisms: for example, many thought e-commerce would lead to widespread fraud when it first became available in the late 1990s.
Due Diligence. Nonetheless, companies looking to “outsource” applications, platforms, or infrastructure to the cloud should investigate the cloud providers operations to ensure that they can meet your system level agreements for security, availability, reliability, scalability, and performance. For instance, what is the providers failover and backup procedures? Do they have a disaster recovery plan? Do they comply with SAS 70 data center security protection guidelines?
In addition, you should carefully analyze pricing policies and total cost of ownership. Does the SaaS provider charge set up or cancellation fees? At what point in the future will the total cost of the SaaS solution cost more than if you had purchased a premises-based license?
Finally, you should analyze the vendor’s viability. SaaS vendors take on greater risk than traditional software vendors because their financial model accumulates revenues on a subscription basis rather than upfront. And since SaaS vendors must invest in more hardware and customer support resources, they are prone to suffer from lack of capital. As testimony to the challenge of launching SaaS-based products, LucidEra, one of the first BI for SaaS offerings, closed its doors in June because it couldn’t secure another round of funding. (See my blog: "The Economy Takes Its Toll.")
Conclusion
BI for SaaS offers a lot of promise to reduce costs and speed deployment but only for companies whose requirements are suitable to cloud-based computing. Today, these are companies that have limited or no available IT resources, little capital to spend on building compute-based or software capabilities inhouse, and whose BI applications don’t require significant, continuous transfers of data from source systems to the cloud.
Posted by Wayne Eckerson0 comments
This past week, I learned that two BI startups—Dataupia and LucidEra—lost their funding and will soon fade from the limelight. In normal times, investors would have considered both companies good bets to achieve an IPO or major acquisition. Both had gained traction in the marketplace: Dataupia, a data warehouse appliance, had five customers and many prospects in a hot market, while LucidEra, a first mover in the BI software-as-a-service market, had a strong pipeline of customers.
These two companies brought new innovations the market, and it’s sad to see them go. I wonder how many other startups are teetering on the edge of extinction. A recent Gartner Group report claimed that big BI vendors were expanding at the expense of mid-market ones (and presumably small ones as well), suggesting that customers have been engaged in “stack-centric buying,” according to Gartner analyst Dan Sommer, as quoted in InformationWeek.
Given the current cost-cutting environment, it makes sense that customers would reduce BI expenditures by consolidating on a single platform (although this requires a significant capital outlay.) And many customers probably fear purchasing BI software from smaller vendors who may not outlast the downturn.
I’ve been asked several times in public forums about the state of innovation in the BI industry. Usually, the question stems from recent market consolidation and fears that big ERP/CRM vendors (i.e. Oracle, SAP, et. al.) will stifle BI innovation as they focus on integrating product lines and people and driving sales of newly minted mainstream software (i.e. BI tools and platforms.) Although ERP vendors may bureaucratize BI and lose talented people in the process, it appears that they may be our best chance of keeping innovation alive, until the economy makes a substantial recovery.
Posted by Wayne Eckerson0 comments
TDWI Germany had its annual conference in Munich this week. Defying the economic downturn, the conference drew 450 attendees (same as last year) and 36 exhibitors (more than last year.) It is now the biggest BI/DW event in Germany and Austria.
I sat down with Guenter Fuhrmeister and Lars Tams of SIGS Datacom, which puts on the TDWI Germany conference, to ask them how they pulled a rabbit out of a hat. Their initial explanation, “We’re not sure!!”
They said they suspected the downturn isn’t quite as severe in Germany as in the U.S., although they said major German companies have frozen travel and training budgets. One major change is that they merged with a competing BI conference run by BARC, a research firm that does hands-on product evaluations. BARC now offers a track of sessions at the conference. Also, the conference has expanded to seven tracks of half-day classess plus sponsored case studies during lunch. With a total of 45+ topics, the conference offers enough varied content to interest everyone.
One big difference with the US TDWI conference is that a larger percentage of attendees have 5+ years of experience, which requires the TDWI German conference to offer many more advanced courses than we do in the US, where our fundamentals classes are still extremely popular. But for those of you in the US who may want to capitalize on this excellent resource, you'll need to brush up on your German since the majority of classes are in the native mother tongue.
We would like to extend a hearty congratulations to our German brothers and sisters and hope to see an even bigger and better event next year!!
Posted by Wayne Eckerson0 comments
I love software that I can download from the internet, implement without reading a manual or attending a training class, use in production free of charge for 30 days, and then purchase with a credit card at bargain basement prices.
I did just that recently with Citrix’s GoToWebinar software. I even conducted a very successful live Webinar for 300 people before the trial period ended. For a fraction of the price and with almost all the same bells and whistles, GoToWebinar puts competing products to shame, such as On24, WebEx, and LiveMeeting.
You might assume, as I did, that this bright new era of Web-based software distribution is suitable for low-end solutions and consumer-oriented software, but certainly would never work for enterprise-caliber systems, such as those we have come know and love (or hate?) in the data warehousing (DW) and business intelligence (BI) market. But you would be wrong.
15-minute Rule
I had a nice chat today with Miriam Tuerk, CEO, and Susan Davis, VP of marketing, at Infobright, an open source provider of a high-end analytical platform by the same name that targets the MySQL market. The company, based in Toronto, was founded in 2005, began shipping product in 2007, and now has 50 paying customers, mostly mid-market companies in the Internet, telecommunications, and financial services markets that want to analyze large volumes of data and expect fast query performance at low cost without much setup or maintenance.
“We have a 15 minute rule,” says Tuerk. “A knowledgeable MySQL database administrator should be able to download Infobright and implement it within 15 minutes.” Tuerk estimates that 10,000 individuals have downloaded the free, community version of the software. Paying customers, which include Xerox, Telus, and the Royal Bank of Canada, pay annual fees of $9,950 and $15,950 per terabyte for additional features, such as faster loading, support for slowly changing dimensions, the ability to insert, update, and delete data from the column-store database, and guaranteed support levels. That’s a bargain as far as I’m concerned.
Although Infobright gives up potential revenue by using this pricing and distribution model, it saves a lot by not having to conduct expensive proofs of concept in competitive deals at enterprise accounts.
Secret Sauce
Infobright is not only easy to do business with, it has some interesting technology that sets it apart from the pack of 20+ analytical platform providers crowding the market these days. It doesn’t require database designers to create indexes, partitions, and aggregates and minimizes schema design and ETL work. This saves time and money and requires fewer experts to get the system up and running.
Data Packs and Compression. It stores columnar data in 64k data packs, each of which can be compressed with different compression algorithms that are best suited to the data within. So, Infobright compresses data to one-tenth to one-fortieth of the raw data size. This lowers cost by reducing the amount of hardware and storage needed to analyze large data volumes, and it accelerates data loading speeds, which Tuerk says are the fastest in the industry per server at 280GB/hour.
Metadata. While most database management systems store two or three times the amount of raw data due to overhead (e.g. indexes, aggregates, partitions), the only extra data that Infobright adds is what it calls a Knowledge Grid, which is usually small enough to store in memory, according to Tuerk. The Knowledge Grid is metadata about the data packs—statistical data (min/max, average, counts, etc.), histograms of the data values in each data pack, and relationships among data packs. Many queries can be answered from the Knowledge Grid alone, accelerating response times to the speed of memory.
Query Optimization. Using statistics and pointers, the Knowledge Grid enables the Infobright optimizer to quickly identify the handful of data packets that need to be decompressed to resolve a query. It also works heuristically, using intermediate results to refine query plans. Rather than spreading queries and I/O across multiple nodes like MPP databases, Infobright’s architectural approach is premised on doing as little disk I/O as possible.
Scalability. From a hardware perspective, Infobright is a single-server system that currently scales to 50TB although Tuerk says that is not a physical limitation and systems can handle more data if necessary. It provides full support for SQL 92 and some SQL 99 extensions but it doesn’t yet participate in TPC benchmarks, so it’s hard to validate scalability claims. Davis says they’ve been reluctant to participate because some benchmarks require full table scans, which is what their architecture tries to avoid.
From a query perspective, each processor core running on a Windows, Linux, or Solaris server can handle a single concurrent query at peak performance. So a 32-core system can handle 32 concurrent queries at peak performance, which is a significant limitation for customers at the high-end of their target market. As a consequence, Infobright has been working on a multi-server option—which it will ship later this year—that will let customers add servers and/or storage to scale out the amount of data or concurrent queries the system can support. This is not an MPP system, just a multi-server system using a shared disk architecture.
Conclusion. Overall, if you want a quick and easy analytic platform that is also powerful enough to meet the analytical needs of 95% of organizations, you should consider Infobright. They do it right!!
Posted by Wayne Eckerson0 comments
BI environments are like personal computers: after a year or two, performance starts to degrade and you are never quite sure why. The best explanation is that these systems start accumulating a lot of “gunk” that is hard to identify and difficult to eliminate.
Personal computers, for example, become infected with viruses, spyware, and other malware that wreak havoc on performance. But we cause many problems ourselves by installing lots of poorly designed software, adding too many memory-resident programs, accidentally deleting key systems files, changing configuration settings, and failing to perform routine maintenance. And when the system finally freezes up, we execute unscheduled (i.e. three-finger) shutdowns, which usually compound performance issues. Many of us quickly get to the point where it’s easier and cheaper to replace our personal computers rather than try to fix them.
Unfortunately, BI environments are much harder and more expensive to return to a pristine environment. Over time, many queries become suboptimized because of changes we make to logical models, physical schema, or indexes or because we create incompatibilities when we upgrade or replace drivers and other software. Each time we touch any part of the BI environment, we create a ripple effect of problems that makes IT adverse to making any changes at all, even to fix known problems! One data architect recently confessed to me, “I’ve been trying 10 years to get permission to get rid of one table in our data warehousing schema that is adversely affecting performance, but I haven’t succeeded.”
But when IT is slow to make changes and maintenance efforts begins to dwarf development initiatives, then the business revolts and refuses to work with IT and fund its projects.
The above architect said the solution is “better regression testing.” The idea is that if we perform continuous regression testing, IT will be less hesitant to change things because it will see quickly whether the impact is deleterious or not. However, this is like using a hammer and chisel to chop down a tree. It will work but it’s not very effective.
The better approach is to implement end-to-end metadata so you can see what impact any change in one part of the BI environment will have on every other part. Of course, a metadata management system has been an elusive goal for many years. But we are starting to see new classes of tools emerge that begin to support impact analysis and data lineage. ETL vendors, such as Informatica and IBM, have long offered metadata management tools for the parts of the BI environment they touch. And a new class of tools that I call data warehouse automation tools, which automatically generate star schema and semantic layers for reporting, also provide a glimmer of hope for easier change management and reporting. These tools include Kalido, BI Ready, Wherescape, and Composite Software with its new BI Accelerator product. You’ll hear more about these tools from me in future blogs.
Posted by Wayne Eckerson0 comments