Kalido last week announced an all-in-one analytic system—from hardware to software to services—targeted at the pharmaceutical and insurance industries. This newfangled packaged analytics application got me thinking about the long quest by BI vendors to become “the SAP of BI.” Let me explain.
SAP became a $16 billion company by offering packaged transactional applications to replace legions of outdated, non-integrated, homegrown applications. For the past 15 years, many BI vendors have believed that a similar opportunity exists to sell packaged analytical applications to replace antiquated, homegrown reporting systems or consolidate a myriad of legacy BI tools and reports. The idea of racking up billions selling cookie cutter applications had an irresistible appeal.
Challenges
But like Odysseus and the Sirens, the lure of packaged analytic applications has caused a lot of shipwrecks and near misses. The problem is that packaging analytics is like trying to grab a greased pig. Every customer sources data from different types of systems and each thinks that they have unique processes which require customizing the default application model and reports.
Very quickly, these “load and go” analytic packages morph into colossal custom consulting projects. At the end of the process, the customer realizes that it would have been cheaper and quicker to build the application from scratch. And to add insult to injury, the customer has no clear path for upgrading their customizations to the next version of the package.
On the vendor side, it takes deep pockets to support a packaged analytics strategy. You need to hire domain experts to flesh out a credible business model and reports. Then, you need to build a suite of cross-departmental applications because few companies will commit to one packaged application while other its others are custom built. Then, you need to verticalize the functional applications to ensure the models and reports cleave as close to customer requirements as possible without customization. You also have to port the applications to run on multiple platforms and support multiple languages. Finally, you need to provide predefined ETL mappings between all major source systems and applications and your target data models, and keep all the mappings up to date with each new release of the source system or application. Phew!!
The Few and the Many
Few vendors have the appetite for all this. To date, Oracle leads the pack, having made a genuine commitment to expand the packaged analytic applications it inherited from Siebel Systems. It now offers more than 50 applications across seven functional areas and is in the process of verticalizing them. It has more than 2,000 customers and generates more than $100 million a year from the business.
SAS also has made a big commitment to packaged analytic applications, offering a variety of solutions across dozens of industries that embed complex analytics, including fraud, anti-money laundering, supply chain intelligence, sustainability metrics, and so on. Chief technology officer Keith Collins told me recently that SAS probably couldn’t have made the broad and sustained commitment to offering packaged analytic applications if it was not a private company that had the luxury of making long-term investments without short-term payback. Part of the problem with domain-specific packages is that they narrow the market of potential customers, which extends the payback period significantly, he commented.
IBM Cognos has focused on solving the customization conundrum by creating model-driven applications that can be modified via metadata. However, it only offers a handful of these adaptable applications. Teradata also offers packaged analytic applications for CRM and supply chain. And of course, SAP makes all of its transaction content available as data marts, but I suspect most of these are used largely for operational reporting and aren’t easily extendable to non-SAP data sources.
The Newest Entrant – Kalido
Despite the odds, hope springs eternal. Kalido's announcement last week of KONA, an all-in-one packaged analytic applications priced at $450,000 that comes bundled with Kalido’s data warehousing software, BI tools, reports and dashboards, hardware, and services, has breathed new life into the notion of a packaged analytic application.
By embedding the application inside a data warehousing appliance, Kalido offers a new twist on the old story. It's goal is to simplify and speed the deployment of data mart applications and minimize the risk by offering everything you need at a fixed price with consulting services to ensure rapid and successful deployment.
Specifically, KONA embeds Kalido’s data warehousing and MDM engine and QlikTech’s QlikView BI tools within Netezza’s new TwinFin appliance. It offers canned solutions (i.e. ETL, reports, and dashboards) for two vertical markets: sales and marketing in the pharmaceutical industry and sales and distribution in the insurance industry. It will be interesting to see how quickly Kalido can ramp up sales.
The sweet spot for packaged analytic applications is small- and medium-sized businesses and departments in large companies with little to no IT support. With business increasingly beating the “faster, better, cheaper” mantra, the time may finally be right for the era of packaged analytic applications. Certainly, a few veteran BI vendors and some upstarts are determined to get the formula correct.
Posted by Wayne Eckerson0 comments
If you think that semantics is a huge problem for data warehousing initiatives—and it is—it’s an even bigger problem for our industry at large.
Take the word analytics, for example. It’s a popular term right now: reporting is passé; everyone wants to do “analytics.” And like most popular terms, it’s been completely bastardized. This is largely because vendors want to exploit any term that is popular and bend it to match their current or future product portfolios. But it’s also because we’re too complacent, uninformed, or busy to quibble with exact meanings—that is, until we have to plunk down cold, hard cash or risk our reputation on a new product. Then we care about semantics.
Most vendors use the term analytics to describe what I would call “interactive reporting.” Evidently, any tool that lets users filter data on page or drill down to greater detail qualifies as “analytics.” This isn’t wholly inaccurate since Webster’s dictionary defines analysis (the root of analytics) as: “Studying the nature of something or determining its essential features and their relations.”
“We should use labels to clarify not obscure meaning.”
But let’s get real. We should use labels to clarify not obscure meaning. Reporting tools have given users the ability to filter, sort, rank, and drill for years, and yet we never called them analytical tools. Instead, we’ve used the terms ad hoc query, end user reporting, dashboards, scorecards, and OLAP. To borrow a biblical phrase, let’s not put old wine into new wineskins. Otherwise, we simply spoil something good.
“Analytics is easy to say but hard to do.”
Let’s be clear: analytics is a natural progression of BI from reporting on historical activity to applying statistical techniques and algorithms to identify hidden patterns in large volumes of data. We can use these patterns and relationships to create models that help us understand customer and market dynamics and predict future events and behavior. Thus, analytics is a marked departure from traditional reporting in terms of scope, depth, and impact. It is easy to say but hard to do. This is why so many vendors have jumped on the analytics bandwagon without sporting any real credentials.
One of the few vendors that has marked a steady course in the usage of analytics is SAS. I talked with Keith Collins, SAS’ chief technology officer, last week about this issue, and all he could do is shake his head and commiserate about the bastardization of a term that is near and dear to his company’s heart. On the bright side, there could be worse things than for neophyte vendors to co-opt your semantics. Even if their current products don’t support honest-to-goodness analytics, their product roadmaps do.
In the big scheme of things, the bastardization of analytics is actually a bridge to the future. We use words to propel our thinking ahead as we prepare our bodies to follow. So, give it five or ten years and analytics will have a distinct meaning from reporting. By that time, I’m sure we’ll be bastardizing some new BI term.
Posted by Wayne Eckerson0 comments
Once compared to David facing Goliath, database vendor Netezza yesterday traded in its wooden slingshot for steel blades and armor as it both celebrated its victories to date and geared up to fight bigger adversaries.
With nearly 300 customers and a new “commodity-based” architecture, Netezza is the clear leader in the emerging analytics database market that it evangelized beginning in 2002. It celebrated is stature and market position with a high-energy, one-day event in Boston that kicks off a worldwide roadshow.
Almost 400 attendees (a good percentage being Netezza employees to be fair) heard CEO Jim Baum introduce the new Netezza TwinFin data warehouse and analytic appliance that boasts higher performance, greater modularity, and more openness and flexibility to handle various workloads than its predecessor boxes. Netezza primarily designed TwinFin to address new customer requirements but secondarily to strike a blow to “new” arch competitors Teradata and Oracle.
“We’re 50 times faster than Oracle and ten times faster than Teradata without tuning,” said Baum. Other Netezza executives added that the company’s platform is no longer a one-trick pony. “We’re moving from supporting fast scans to multiple workloads that address broader market demand,” said Phil Francisco, VP of product management and product marketing, in a pre-briefing this summer.
While none of the customers it highlighted during the day-long event on Boston’s waterfront were using TwinFin in production, most touted dramatic performance gains compared to competitor products in head-to-head tests. Some were testing TwinFin and most seemed eager to take the plunge, especially high-end customers who could benefit from the open architecture that makes it easier to embed advanced analytics programs.
Migration and Markets
What wasn’t discussed, however, was the time and cost to migrate from Netezza’s existing boxes to TwinFin. I raised this question with Netezza marketing cohorts Phil Francisco and Tim Young this summer. They said that most existing Netezza customers will eventually swap out old boxes with TwinFin as they exceed the capacity or performance requirements of existing machines. One of the limitations of the old architecture was relatively fixed capacity boxes with limited extensibility for growth. They implied that this type of forklift migration would be no surprise to existing customers, which is one of the downsides of selling “appliances” where everything is pre-built inside a box.
However, that doesn’t mean that Netezza will stop selling appliances—by definition, a complete hardware/software solution that requires no assembly and minimal configuration and tuning. You won’t be seeing a software-only version of Netezza TwinFin for sale. Netezza will still ship out appliance machines, except now the new open architecture dramatically improves the system’s overall flexibility and extensibility.
Perhaps more importantly, TwinFin is designed to address a new market. “We’ve moved past the early adopter, risk-taker market and are addressing a more mainstream customer,” said Young. While existing customers will be the first to adopt TwinFin, ultimately the new product is designed to position Netezza as an attractive alternative to leading database vendors.
Open Architecture
Still, it takes some courage to revamp your architecture when you have a large installed base. But many young, ambitious companies have had to undergo this painful baptism—sometimes multiple times—to position themselves for future growth. Business Objects, MicroStrategy, and Cognos all come to mind.
But Netezza may get off easy. No one seemed up in arms about the architectural shift, probably because most people—customers, analysts, press—seem to understand the benefits of building database systems on commodity hardware. (We should thank Greenplum, Aster, and other analytic database upstarts for that.) The shift means that it will spend less time engineering hardware and more time delivering value-add capabilities through software.
Netezza already is attracting many partners who find it easier to build applications and plug-ins within the open architecture running on blade-based servers, commodity disk storage, Intel chips, Linux operating system, and SQL, ODBC, JDBC, and OLE DB data access interfaces. Also, Netezza will enable customers to deploy TwinFin appliances in hub-spoke configurations with up to 10 racks to increase extensibility. It will also soon introduce specialized TwinFin appliances tuned for different workloads, including high capacity storage (up to 5 PB) and extreme performance (1 TB RAM per rack), a move eerily similar to Teradata’s lineup of new appliance machines.
Despite the hype, the future of TwinFin rests in the hands of customers who will vote with their pocketbooks. Netezza has claimed some impressive victories to date, but it has many battles to fight before it can claim the crown.
Posted by Wayne Eckerson0 comments
I took a briefing yesterday with SenSage, a company I didn’t know. Consequently, I assumed SenSage was another startup pitching the latest, greatest technology, but I was wrong. Although SenSage is the newest entrant in the boisterous analytic database market, it is not a new company: it’s a tried and true player that offers an MPP-based columnar database that has hundreds of customers and strong partnerships with EMC, Hewlett-Packard, SAP, and McAfee.
So, why haven’t I heard about SenSage?
Six years ago, SenSage decided to apply its technology to a narrow market rather than offer a general purpose analytical engine. It chose the security and compliance market, packaging its high-performance database as a solution for meeting emerging “log management” requirements. New regulations, such as SOX and HIPAA, require organizations to store (i.e. archive) transactional log data to support compliance auditing, forensic investigation, and root cause analysis. By wrapping its database with customized ETL and reporting/analysis applications tailored to log management requirements, SenSage offers customers better performance, faster time to market, and lower cost than rivals, which include IBM, Teradata, and Oracle, which do not have dedicated log management solutions. Rather than archiving data to offline storage, SenSage makes the archived data available online so users can query and analyze the data in real-time.
So far, so good. But what makes SenSage think it can break through the noise in the current analytic database market?
SenSage’s differentiator is that it supports high-volume “event” data, which is why it calls its product the SenSage Event Data Warehouse. By events, SenSage means high volumes of source system transactions that it captures from log files or directly from the source applications. It has built a good business capturing systems log data for auditing and compliance purposes, but it also boasts several telecommunications companies that use the product to capture and analyze call detail records. Other potential event data that SenSage wants to target include point-of-sale data, RFID data, Web traffic, and email.
I still have a lot to learn about SenSage before I can make an accurate assessment about its capabilities and prospects. But they’ve got a track record, which is more than most analytic database vendors. So they’ve got my attention!
Posted by Wayne Eckerson0 comments
How do you deliver dashboards that end users will adopt and use? That was the gist of the insightful and humorous presentation titled “Dashboards to Die For” delivered by John Rome, Associate Vice President in the Technology Office at Arizona State University (ASU), at TDWI’s BI Executive Summit in San Diego earlier this month.
ASU’s dashboard project started with a memo from the University’s president to the CIO, Adrian Sannier, Rome’s boss, that said “Adrian, learn all you can about Dashboards and then see me.” (See figure 1.) With a data warehouse already in place, the dashboards would be instrumental in driving usage to higher levels, making BI pervasive, according to Rome.
Figure 1.
The data warehouse already contained most of the data so ASU only needed a flexible development tool and design principles to put the icing on the cake. It chose a dashboard tool from Corda Technologies which enabled it to create dashboards quickly by pulling data from any system, including the data warehouse. It then consulted a few dashboard and design experts, including Edward Tufte, Stephen Few, and yours truly.
Four years later, ASU has deployed dozens of dashboards in multiple departments and now has its own tips and techniques for delivering user-friendly and powerful dashboards. Here are a few of John’s recommendations:
<!--[if !supportLists]-->
- Embed dashboards as a link within the corporate portal so users have one click access to the information
- The best screen size for the dashboard window is 1024 x 768
- Place the most important elements for viewing in the upper left hand corner and the least important in the lower right corner to mimic the way the eye scans a page.
- Avoid decorative dashboard elements, like dials, gauges, and images and cluttering the screen with images and color.
- Design your dashboard pages to mimic popular Web layouts.
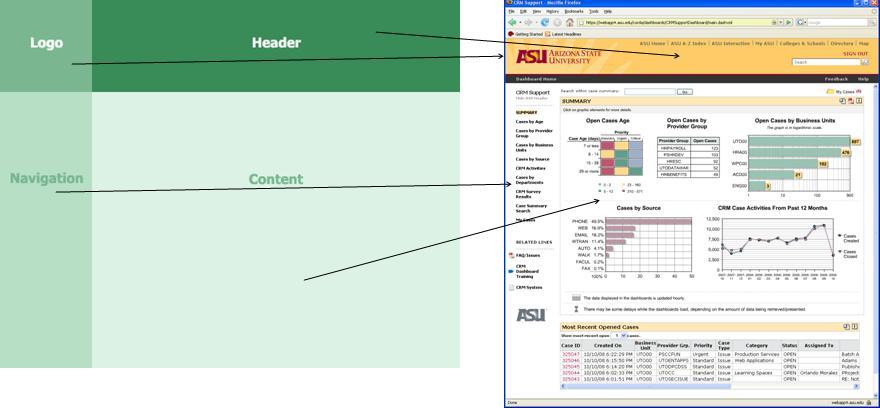
- Create a summary screen of the most important information. (See figure 2.)
Figure 2.
- Place elements on the screen so users don’t have to scroll.
- Add a “design tip” logo that users can click to get techniques about using the displayed elements and offer an online help center that provides a directory of topics for using the dashboards.
- Avoid pie charts, 3-D elements, and gradient shading.
- Accommodate color blindness.
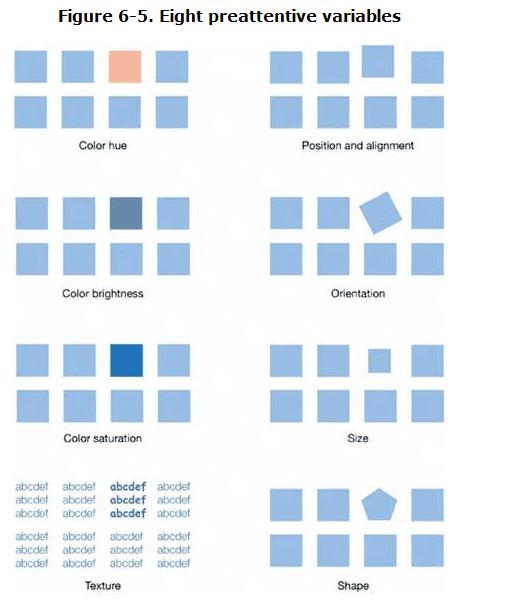
- Accent key variables with subtle hues or patterns. See figure 3.
Figure 3. From
The Dashboard Spy.
- My favorite: “Power comes with interaction/drills.”
- Make dashboards actionable. Here ASU has bidirectionally linked its dashboards to various operational systems, such as its PeopleSoft HR system, so authorized users can update the status of employees, classes, students, professors, etc.
- Use non-serif fonts and 12 point text for the main body and smaller fonts for supplementary text.
- Provide metadata about metrics, including SQL used. Offering screen cams and FAQs also helps.
- Use ranking to help users assess key elements within the data and to promote friendly competition among peer groups.
- Use charts rather than tables.
- Abbreviate numbers appropriately, so that $13,002,000 is $13M
- Perform usability studies to understand how users interact with the dashboard.
- Customize the dashboards by role.
Of all the design tips, the most powerful are to make the dashboards drillable, actionable, and instantly informative. ASU has put a lot of time and thought into the design and delivery of its dashboards and the effort has paid off. But don’t just take my word for it; check out ASU’s public dashboard Web site where you can get more information about the dashboards used at the University: http://dashboard.asu.edu.
Posted by Wayne Eckerson0 comments
The biggest mistake that I see companies make when purchasing BI tools is straddling the middle. In their quest to standardize on a single BI tool for reporting and analysis to achieve cost-savings and supplier simplification, they fail to meet the needs of any users. Typically, the tool is too powerful for casual users and not powerful enough for power users. Consequently, everybody loses and the BI program doesn’t get traction within the user community.
A Tool for Every Occasion. Although organizations need to standardize their BI architectures, it’s important to purchase multiple tools to meet the needs of different types of users. This is especially true for power users—business analysts, super users (ad hoc report developers), analytical modelers, and IT report developers—who perform a variety of tasks that involve true ad hoc access to data. Would you hire a carpenter to build an addition on your house if he only had a hammer in his toolbox? No, you would want a carpenter with a tool for every task to make his work more precise and efficient. The same is true for power users. The more tools the better.
Governance Needed. What’s more important to standardize than tools is the reports that power users publish for general consumption. This process needs to be controlled by a BI governance team that manages the list of “certified” reports used for corporate and departmental decision making. Although power users should be empowered to perform ad hoc analyses where data and reports do not exist, they should not be allowed to willy nilly create standardized, scheduled reports without approval from a BI governance team or report advisory board.
Ironically, the BI advisory board should be comprised of a cross-functional group of power users who have a vested interest in promoted business intelligence throughout the organization. Power users wield considerable influence in the successful outcomes of BI program. Getting them on your side by appointing them to BI advisory boards and empowering them with the tools they need is a key element in achieving BI success.
The Key to Standardization. After reading the above, you might think I’m against standardizing BI tools. I am not. Most organizations today are establishing standard toolsets for reporting, dashboarding, and advanced analytics. And today’s BI vendors offer robust suites of tools for every occasion so it’s easier than ever to standardize on a single vendor, if not a single toolset. Yet, most BI suites have weak spots and may not be as integrated as advertised. Most companies still pursue a best of breed strategy, often standardizing on toolsets from different vendors.
The point is that although tools standards are important, they pale in comparison to the need for standards to govern data and scheduled, interactive reports. Unfortunately, most BI governance programs focus on tools at the expense of delivering consistent information. So don’t get hung up on how many BI tools exist in your organization—especially when it comes to power users—more tools may actually be a sign of strength than weakness.
Posted by Wayne Eckerson0 comments
More than 70 business intelligence directors and sponsors gathered in San Diego this week for the TDWI’s semi-annual BI Executive Summit. The executives were enlightened by a mix of case studies (NetApp, Dell, Arizona State University, RBC Wealth Management, and ShareThis) and educational sessions on key areas of interest (BI in the Cloud, change management, cost estimating BI projects, Hadoop, visualization, BI mashups, social intelligence, pervasive BI, and the future of BI.)
The attendees also voted on technologies and programs that will be of key interest to them in the next three years. Topping the technology chart were predictive and in-database analytics, dashboards, visualization, the cloud, and operational BI. On the process side, key initiatives will be data quality and governance, business process management, and BI competency centers.
The event’s sponsors also chimed in during sessions and the future of BI panel. Teradata discussed active data warehousing, Information Builders showed how to integrate strategic, tactical, and operational BI, Birst discussed the benefits of cloud-based computing via its customer RBC Wealth, Sybase discussed in-database analytics via SQL-based plug-ins from Fuzzy Logix, and IBM discussed innovations in BI, such as search, collaboration, and mashups.
Most attendees valued the networking and collaboration that the event offers during lunch and breaks. In addition, hands-on workshops put the attendees in the drivers seat. During the Dell case study, attendees were given a real-life scenario of Dell’s data warehousing environment circa 2007 and then in groups had to decide how they would have approached the issues that Dell faced. After considerable discussion and debate, representatives from Dell—who were actively taking notes during the discussion phase—told the audience how they approached the situation. The workshop on change management also asked the attendees to work in small groups to discuss the implications of the FEE (fear, entitlement, earning.)
Quotable Quotes from the event:
- “You typically only need 12 metrics to run a company.” Tony Politano, consultant and author of Chief Performance Officer
- “Our dashboards, which are all built on the same platform and enterprise model, provide enterprise, functional, and role based views of information.” Dongyan Wang, NetApp
- “We designed the dashboard so that any user could get any information they want at any level of detail in three clicks.” Dongyan Wang, NetApp
- “A dashboard should provide more than composite views of information; they should allow users to create a personalized mashup via Web services and widgets so the environment caters to their needs.” Laura Edell Gibbons
- “Add a top 10 list to your portal to enhance usage and pay attention to principles of visual design.” John Rome, Arizona State University
- “We inventoried our spreadmarts and found we had about 40,000 around the world and that didn’t even count spreadsheets.” Rob Schmidt, Dell
- “It’s important to pick data governance decision makers at the right level; we had Michael Dell’s direct reports.” Mike Lampa, Dell
- “The initial response of the business units to the decision to shift analysts who spent most of their time creating reports into IT was ‘Go to hell!’ But quickly, the saw that the move would free up budget dollars and headcount for them and they bought into the decision.” Mike Lampa, Dell
- “One lesson learned [during the Dell DW renovation] was losing sight of the importance of delivering value while establishing and enforcing enterprise standards.” James Franklin, Dell
- “Our BI architectures are rooted in outdated assumptions of resource scarcity.” Mark Madsen, Third Nature
- “Because of advances in processing and storage power, we could now ship the data warehouse that I built in 1993 for $1.5 million on a laptop to every individual in the company.” Mark Madsen, Third Nature
Posted by Wayne Eckerson0 comments
Yesterday, I had doubts about the value of driving from Boston to New York (eight hours roundtrip) to attend a short IBM briefing on Smart Analytics, but thankfully IBM didn’t disappoint, at least in the end.
SPSS Acquisition
The Non Announcement. The briefing consisted of two announcements and one non-announcement.
The non-announcement was that IBM acquired leading analytics vendor, SPSS, for $1.2 billion. Oddly, the acquisition wasn’t the focus of the Smart Analytics briefing I was attending, as I assumed once I saw the press release. In fact, as I learned later, it was a coincidence that the SPSS announcement occurred on the same day as the Smart Analytics briefing. This was reinforced by the fact that the IBM software executives (Steve Mills and Ambuj Goyal) didn’t say much about the acquisition other than it would “embed the technology across our platform.” What I find strange about that statement is that IBM had a great data mining product called Intelligent Miner which it discontinued as a standalone product several years ago and embedded its functionality inside DB2 and other applications. So, they basically bought what they already had or still have. Odd.
Anyway, after five minutes discussing its head-turning non-announcement, IBM then turned to the real focus of the briefing, which was to announce the Smart Analytics System and the Smart Analytics Optimizer. The first is a new twist on an old yarn, but the second is potentially groundbreaking.
IBM Smart Analytics System
InfoSphere Redux? To understand the Smart Analytics System, you have to know what IBM means by analytics. To IBM, analytics is Cognos 8—which in reality is query, reporting, dashboarding, and some OLAP. It’s not data mining or predictive analytics (things that SPSS does), although I suspect that will evolve in short order.
What I gleaned in one-on-one meetings after the briefing (IBM briefings are traditionally long on concepts and short on details) is that the IBM Smart Analytics System is IBM Infosphere Balanced Warehouse done right, with Cognos 8 embedded as an optional add on. At least this is the first instantiation of the Smart Analytics System. Eventually, IBM will embed other components from its vast array of ever expanding software products into the Smart Analytics System, including presumably SPSS, as well as ETL, data quality, cubing, and archiving. It will also expand the platforms supported (beyond the IBM Power platform currently) and the number of high-end, out-of-box configurations (currently, based on data volumes: 4TB, 12TB, 25TB, 50TB, 100TB, and 200TB.) So from a systems perspective, it’s not all that new.
Radical Reworking. But from a customer and IBM perspective, Smart Analytics System represents a fundamental overhaul of how IBM goes to market and meets customer needs. For the first time, customers can purchase a vertically integrated IBM system—from hardware and software to tools and applications to consulting and support services—with a single SKU and have the system configured, tested, and shipped in as little as two weeks with a single point of contact for support. IBM will then periodically perform health checks to ensure performance still meets customer requirements.
Back to the Future. If you have some history in the high tech market, you might remember that this is similar to the way that IBM operated prior to the early 1990s. If you were an IBM customer then, you bought vertically integrated systems to run your core applications and were a “big Blue” shop through and through. But with the advent of Unix and open computing, IBM began losing market share, and to ward off financial ruin, it brought in CEO Lou Gerstner who decided to blow apart IBM’s business and systems models. To overcome the stigma of selling closed, proprietary systems in an open world, Gerstner created autonomous divisions for hardware, software, tools, and services and gave them permission—in fact exhorted them—to partner with all players, including fierce competitors of the other divisions. In short order, IBM consultants began recommending non-IBM hardware and software, DB2 began running on non-IBM hardware, and IBM hardware began running non-IBM chips, operating systems, and databases. And it worked financially, saving the company, but it came at a price.
Making IBM Easy to Do Business With. The price is that IBM has become increasingly difficult to do business with. In fact, from a customer perspective, IBM looks and feels like multiple companies rather than one. This increases the costs, complexity, time to value when deploying IBM solutions. To keep legendary IBM executive Tom Watson from rolling in his grave, IBM now is rediscovering its roots and providing vertically integrated systems and a single face to the customer. To do this, IBM is more closely aligning its product divisions, which is perhaps the biggest upshot of the announcement.
IBM’s attempts to reduce costs, complexity, and time to value through the Smart Analytics System resonated with a panel of IBM customers at the briefing. Ironically, none had implemented a Smart Analytics system or had even heard of it until the night before, but all said that it would have saved them a lot of time, money, and headaches. So IBM has rediscovered what worked prior to the 1990s (vertical integration), but without losing what has worked since (horizontal integration.) IBM will need this new hybrid model to compete in an increasingly competitive BI marketplace where established vendors and upstarts are shifting to selling vertically integrated solutions, some using open source and the cloud to radically alter the rules of the game.
Smart Analytics Optimizer
Purpose-Built Analytical Database? Perhaps the more interesting announcement was the Smart Analytics Optimizer, whose details I teased out in a one-on-one meeting with Arvind Krishna, vice president of enterprise information management products. I wanted to ask Arvind when IBM is going to get analytics religion and build or buy a purpose-built database optimized for query processing. But before I could, he rattled off a long list of limitations of traditional transaction databases when performing queries (e.g. ACID properties, logging, indexes, etc.) and the tradeoffs of new query processing architectures (e.g. in memory, columnar, cubes, parallelization, etc.) . He finished by saying, “What if we do it all? Only better?”
Well, that got my attention.
In Memory Sandbox. It turns out that Smart Analytics Optimizer, which will ship in Q4 for IBM Z mainframes, provides a super-fast query database inside a transaction processing system. The Optimizer lets you store a copy of highly trafficked query data in up to 1TB of main memory and uses compression, vector processing, and a proprietary IBM data format ("better than columnar" Arvind says) to accelerate query performance by a factor of 10 or more. From there, IBM’s cost-based optimizer knows whether to direct queries to the in-memory database or the transaction database to get the best performance. Today, IBM consultants will help companies figure out which data to allocate to memory but in the future this task will be automated.
Best of Both Worlds. If I heard Krishna right, then the Smart Analytics Optimizer gives customers the reliability and availability of a transaction system and the performance of a purpose-built query processing system—but all in one system. In other words, customers don’t need to offload queries from a transaction system or offload analytics from a data warehouse. They might only need one system for transactions and analytics! This saves plenty of dollars compared to offloading queries to a stand alone analytical system. Eventually, the Smart Analytics Optimizer will be ported to other IBM systems and support upwards of 50TB of main memory, Krishna says.
Last But Not Least. If what Krishna says is true, then IBM has figured out how to make an end-run around the spate of new analytic database vendors in the market today and finally has a response to Oracle’s Database Machine and Exadata Storage Server and Microsoft’s Project Gemini, both of which turbocharge their flagship database management systems with purpose-built analytical add ons.
Posted by Wayne Eckerson0 comments
“The enterprise software market is breaking down,” proclaimed Mark Madsen at a meeting of TDWI’s Boston Chapter yesterday. “And this opens the door for open source software.”
Madsen said the business model for enterprise software vendors has switched from selling licenses to selling maintenance and support. He said maintenance fees now comprise 45% of revenues and a lionshare of profitability. This is largely because the software market has matured and consolidated, leaving customers hostage to a few big companies, Madsen said.
Eager to echo this theme, Brian Gentile, CEO of open source BI vendor Jaspersoft, said the software market is ripe for disruption. “Oracle recently reported it delivered 51% margins for the quarter, yet I hear from countless senior executives that they can no longer afford their current software maintenance contracts and are looking for options.” Gentile said these executives often report that maintenance costs consume up to 80% of their IT budget.
(The TDWI Boston Chapter will make a copy of slides at its Web site shortly.)
As prices rise, IT executives are increasingly scrutinizing exactly what they are getting for their money. Many lament the “feature bloat” of enterprise software. “When I was a BI director,” said Madsen, “we used less than 40% of the features in our BI tools.” “And while open source products may not have all the bells and whistles, they pass the ‘good enough’ test,” said Madsen.
Will Interest Translate into Sales?
Not surprisingly, interest in open source BI tools has skyrocketed as the economy plummeted. Many BI teams are looking for ways to reduce costs while still delivering value. Speaking from the audience, Doug Newton, a data warehousing manager at the Mathworks and a coordinator for TDWI’s Boston Chapter, said that open source software makes it really easy to “kick the tires” before committing to a purchase. He told the audience that he downloaded open source software from Infobright, among others, and liked what he saw, although his company has yet to start using open source tools.
Evidently, Newton is not alone. Gentile says Jaspersoft averages 250,000 downloads a month for its free community edition and has had 9 million downloads since its inception six years ago. “Most aren’t paying us anything… yet,” says Gentile. Infobright, an open source columnar database vendor, which also presented at the event, says it has had 10,000 downloads since it's inception and expects that number to jump as more people hear about the company.
To date, there has been a lot more tire kicking than usage, although many experts (including myself) predict that that will gradually change. The TDWI chapter surveyed its users and found that 55% had yet to deploy open source software. Among those that have implemented open source BI tools, 35% have deployed MySQL, 20% Pentaho, 10% Jaspersoft, 6% BIRT, and 6% Talend. Their primary reason for deploying open source BI tools is cost (75%), followed by quick to deploy (30%) and unhappiness with their incumbent BI tools (14%).
Free Isn’t For Everyone
But not all lookers are hooked. Madsen said open source isn’t for everyone. “Just because it’s free, doesn’t mean it’s right for you.” Madsen said you still need to evaluate open source tools like any other BI tool. He said “missing features,” “lack of scalability,” “need for internal expertise” and “switching costs” are the biggest reasons why companies pass on open source tools.
Most open source BI vendors are small startups, which raises the question of vendor viability. Gentile deflected this issue by pointing to the rich community of developers that surrounds each open source product. “If Jaspersoft were to disappear tomorrow, our code would live on for a very long time because there is a strong developer community that has contributed to the code and is vested in its future.”
Leading Adopters
Small companies are leading the charge into open source BI, according to Madsen, but medium and large companies are not far behind. Small companies are deploying open source BI tools on an enterprise basis while large companies are using it in departmental pockets, usually to augment existing BI tools or fill a vacuum where no BI tools exist, Madsen says.
Kevin Haas, a partner at OpenBI, a BI consultancy that helps companies build applications with open source BI tools, says most of his clients use the free community edition of open source BI products. However, the clients with the biggest applications—those deployed on an enterprise scale—implement the commercial or premium version of the tools, which offer additional functionality for enterprise deployments as well as support, scheduled release cycles, and indemnity.
While adoption by end-user organizations is growing slowly, uptake by independent software vendors (ISVs) has been sizable. Open source makes it easy for ISVs to enrich their own applications by embedding open source reporting or analytical tools into their products. In fact, Gentile said hundreds of thousands of people are using Jaspersoft without knowing it because it’s embedded in other applications. The nascent market for software-as-a-service applications has been a particularly robust market for open source BI vendors.
Inexorable Rise
If the mantra of business today is “faster, better, cheaper” then it’s inevitable that companies need to explore alternatives to traditional enterprise software. Currently, open source BI tools offer significant cost savings over established BI vendors. As open source BI tools mature and continue to undercut established players on price and flexibility, we will see an inexorable rise in the adoption of open source BI tools.
Posted by Wayne Eckerson0 comments
I recently reviewed the course materials for a class titled “A Step by Step Guide to Enterprise Data Governance” taught by Mike Ferguson at the TDWI Munich conference in June. Mike did a tremendous job covering the full scope of the data governance topic.
Mike defines enterprise data governance as “the set of processes by which structured and unstructured data assets are formally managed and protected by people and technology to guarantee commonly understood trusted and secure data throughout the enterprise.”
The elements that Mike puts in the data governance bucket are: data definitions and shared business vocabulary; metadata management; data modeling, data quality; data integration; master data management; data security; content management; and taxonomy design and maintenance.
This is a big vision, and certainly elevates the discussion to its proper perspective: that is, data is a business asset and it’s the responsibility of business to oversee and manage this resource. The corollary here is that IT plays a supporting, not supervisory, role in managing the company’s data.
Central to Mike’s vision of enterprise data governance is a Change Control Board, which is the “gatekeeper” for the shared business vocabulary. This board, which is comprised of data stewards from the business, is responsible for approving requests to change, add, or decommission data items. Implicit in this is that the Change Control Board manages data names and definitions, transformation rules, and data quality rules. And these get baked into data models, BI metadata, MDM models, and taxonomies.
Given how fundamental data is to a business (whether it knows it or not), it’s imperative that a senior executive oversee the data governance team that is comprised of senior business managers and stewards. Maria Villar, owner of MCV LLC, writes, “A business data steward is a leadership position…. who understands the importance of data to their part of the business.” (See “Establishing Effective Business Data Stewards” in the spring 2009 edition of the BI Journal.)
Villar says a business data steward “understands the priorities and strategies of the business unit, commands respect within the organization, builds consensus across a varied set of business priorities; influences and drives changes to business processes, enjoys strong support from senior business leaders, can communicate to business and technical teams, and builds a diverse team of technical and business data experts.
Now that we have the verbiage straight, we have to execute on the vision. And that will keep us busy for years to come!
Posted by Wayne Eckerson0 comments