
Data Stories: Using Visualization to Understand Analysis and Algorithms
These visualizations illustrate pathfinding, image recognition, and clustering algorithms.
- By Upside Staff
- November 18, 2020
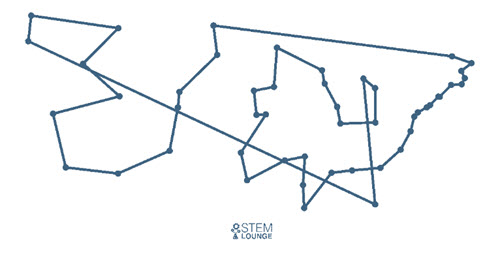
This article on the website STEM Lounge animates several well-known algorithms and heuristics to show how they approach the classic traveling salesman problem.
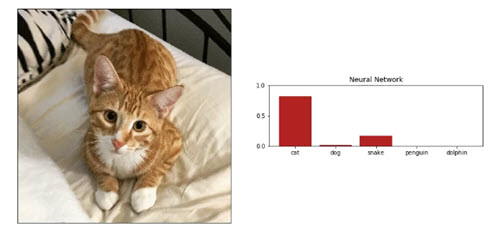
This animated GIF shows the results from a very simple image recognition algorithm in real time, demonstrating its limitations.
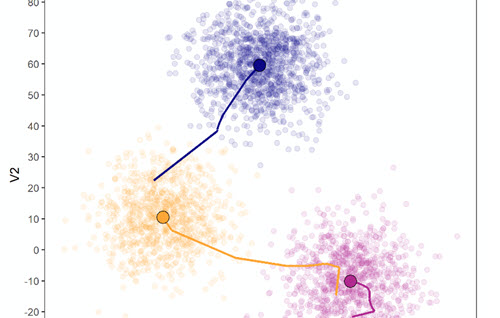
This blog post from data scientist Chris Holmes describes the creation of a simple k-means clustering algorithm and includes an animation that shows how it works.