
Data Stories: Drawing with GPS and Airplane Crashes
A giant GPS drawing, a chart of airplane crash causes, and a graphic showing when planes strike animals.
- By Lindsay Stares
- August 23, 2017
Drawing in the Sky
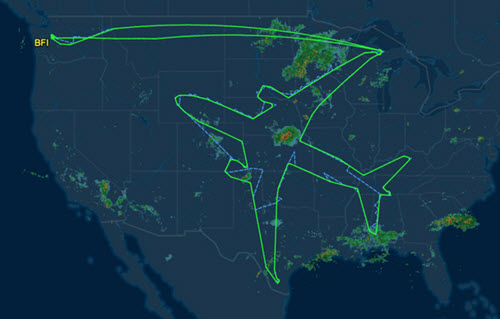
This is only one image, but it represents a lot of calculation and effort! As part of a test flight, a Boeing aircraft actually traced the complete outline of a plane with the flight path.
Why Do Airplanes Crash?

Information Is Beautiful provides this abstract interactive visualization representing commercial plane crashes between 1993 and 2016. You can filter the display by cause and/or the phase of the flight, and hover over any square for more information.
When Birds and Planes Collide
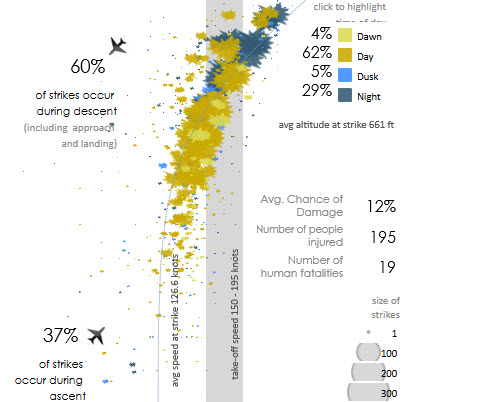
This Tableau-based interactive infographic shows how animals collide with planes. The chart shows at what speed the plane was traveling and the time of day, and you can filter the data by the type of animal. Check the tab at the top for an older version of the same data for comparison.
About the Author
Lindsay Stares is a production editor at TDWI. You can contact her here.