
Data Stories: Real-Time Visualizations Track Edits, Winds, and Smart Lights
What might you discover if you observed your data in real-time? Listen to Wikipedia, watch global weather, and track the lights on a smart street for some inspiration.
- By Lindsay Stares
- June 21, 2017
Hearing Real-Time Collaboration
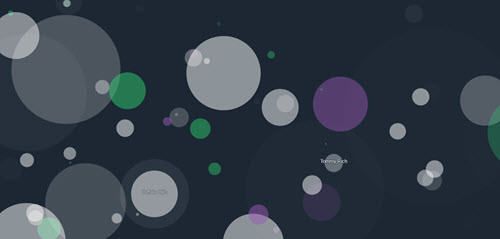
Listen to Wikipedia is a real-time aural and visual representation of Wikipedia edits. Different types of edits are represented by different sounds and colored bubbles. Clicking on any bubble will take you to the edit.
Our Windy World
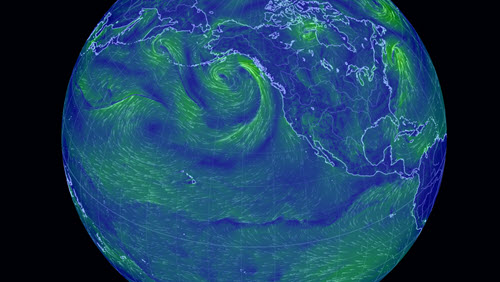
This almost-real-time visualization of global weather conditions is incredibly interactive -- click and drag to move the globe or open the menu by clicking “earth.” You can choose to view multiple types of information about wind, waves, certain atmospheric chemicals, or particulates on nine different world maps.
City Data from Smart Lights
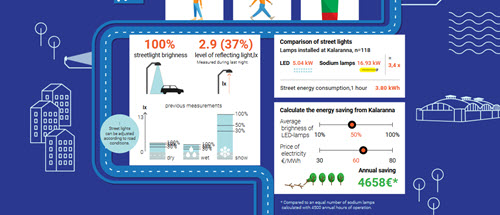
This cute dashboard shows current conditions and recent trends detected by connected devices on a particular street in Tallinn, Estonia. The streetlights are smart devices intended to increase efficiency, and you can read a little more about the types of insights the lights and other sensors are providing on the manufacturer’s blog.
About the Author
Lindsay Stares is a production editor at TDWI. You can contact her here.