
Data Stories: Migration Across Continents, Cities, and Countries
Data visualizations are a great way to look at movement over time -- whether you’re modeling animals, vehicles, or people.
- By Lindsay Stares
- June 14, 2017
The Movement of Species
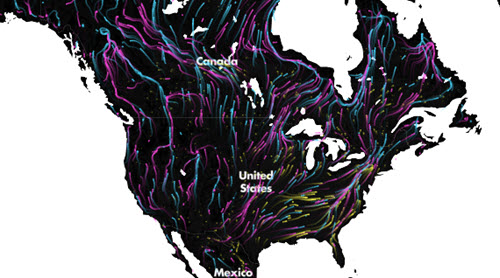
The Nature Conservancy combined habitat data for almost 3,000 species with climate change projections to create this animated map of how mammals, birds, and amphibians may need to relocate as temperatures change in North and South America.
The Motion of the City
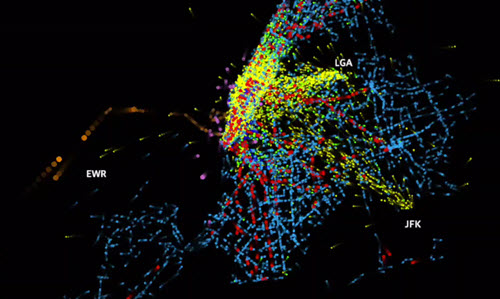
The Atlantic’s CityLab featured this fantastic video visualization of nine modes of transportation over one day in New York City.
Professional Migration
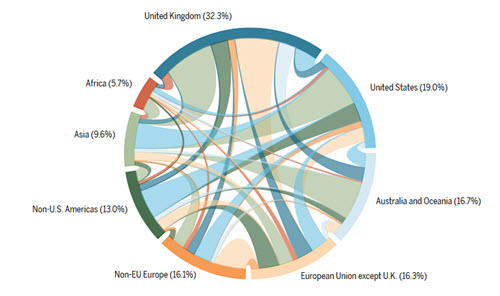
Science analyzed a huge set of academic CVs to create these charts that show where scientists from different countries moved around the world in the pursuit of their careers.
About the Author
Lindsay Stares is a production editor at TDWI. You can contact her here.