LESSON - Finding the Right Answers in a Sea of Data
By Calli Wright, Product Manager, MicroStrategy
Identifying business opportunities, problems, or relationships in a table of data can be difficult and time-consuming. Trying to find the answer to an important business question in terabytes of data can be like trying to find a needle in a haystack. Dynamic dashboards with advanced visualizations solve this challenge by displaying a tremendous amount of data in a highly visual and interactive manner to augment data comprehension and enhance decision making. One of the best approaches to visually communicate data anomalies or business opportunities to nontechnical audiences is through the use of advanced visualizations.
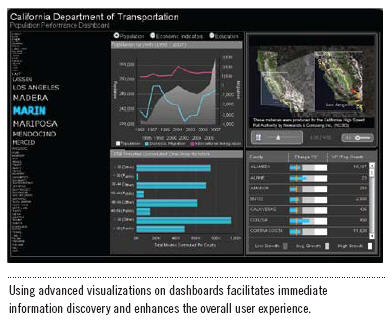
Advanced visualizations support business objectives by enabling users to slice and dice organizational data into easily understood and expressive graphical displays. Using advanced visualizations on dashboards facilitates immediate information discovery and enhances the overall user experience, resulting in increased user adoption. Let’s explore how advanced visualizations can improve the comprehension of data.
Improving Data Discovery
As corporate data increases in size and complexity, the value of advanced visualizations increases exponentially. It is unrealistic to expect a business user to scroll through a large grid of data or attempt to develop complicated metrics for data analysis to answer tough business questions. Alternatively, advanced visualizations can dynamically reorganize and redefine the data so that answers are quickly identifiable.
In this MicroStrategy dashboard, you can see how multiple visualizations are combined to deliver information in various formats. On the far left, a fisheye selector visualization tool is used to magnify and display areas of interest, while filtering out other dashboard content when a selection is chosen. Media visualizations can provide information that is relevant to the audience of the dashboard through images, data-driven movies, and Web content. An example of a media visualization, seen in the upper right corner of this dashboard, is a data video that provides projections on the growing population in California. A bullet graph is used in the lower right corner to compare the performanceto- target for each county’s year-over-year growth in population. The ability to combine data from a variety of sources onto a single dashboard with several different visualizations gives the user a multidimensional view of information to make faster, more informed decisions.
Identifying Opportunities and Bottlenecks
Advanced visualizations can be used to bring to light business opportunities and bottlenecks. Using advanced visualizations with predictive metrics, users can accurately and quickly predict future behaviors based on a current course of action or impending changes made to business processes. For example, if users want to predict net income based on increases or decreases in future costs, they could use visualizations to perform a “what-if” analysis of the data and adjust their budgets accordingly. Likewise, if a large manufacturing company can predict a decline in sales for a particular region, they can decrease production levels to prevent a surplus in inventory. Advanced visualizations help users quickly analyze problematic or opportunistic scenarios for more effective and efficient decision making.
Summary
According to “Emerging Graphic Tool Gets People Talking,” an article published in the Harvard Business Review, authors Wattenberg and Viegas found that using graphics, such as advanced visualizations, to convey data increased user adoption. The number of users analyzing and discussing data increases when advanced visualizations are used with dashboards. The wide range of data visibility and information exploration options available through advanced visualizations provides organizations with the essentials to quickly uncover and communicate business-critical information from their sea of data.