
Introducing the Data Trust Index: A New Tool to Drive Data Democratization
A new Data Trust Index provides a formula that can help your enterprise monitor your data quality and rate data sets to encourage data democratization.
- By Pradeep Karpur, David O'Keeffe, Salma Hassani Alaoui
- May 4, 2023
The Data Management Body of Knowledge (DMBOK), the pre-eminent reference text in the data management industry, defines data quality as “the planning, implementation, and control of activities that apply quality management techniques to data in order to assure it is fit for consumption and meets the needs of data consumers.” Unfortunately, the phrases fit for consumption and meets the needs are highly subjective. This subjectivity has resulted in a proliferation of data quality frameworks publishing various individual dimensions of data quality such as accuracy, completeness, consistency, timeliness, validity, uniqueness, and so on, which has created a commensurate amount of confusion in the user community.
Users are looking for a simple index that will encourage them to trust data and use it. For example, IMDB ratings and Michelin stars both provide a single number that tells consumers what they need to know about the quality of a movie or a restaurant. In this article, we present a single number -- a trust index -- that tells us about the trustworthiness of data.
The Trust Framework
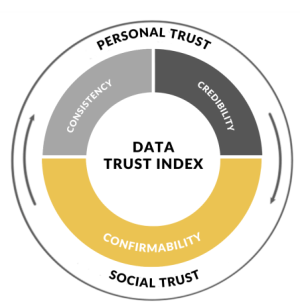
The Trust Framework breaks trust into two components: personal and social. We trust what we know and what we know is informed both by personal experience and by the collective opinion of our social network.
Think about a restaurant where you have typically had a good experience (credibility) but lately, the quality has declined. Will you revisit that restaurant? How much do you weigh your historic experience (consistency) compared to your recent experience in making that decision? Has your social group had similar experiences? If your friends continue to love the restaurant (confirmability) you will be more inclined to give it another chance, otherwise you may opt for another restaurant.
It is the interplay among all these aspects that establishes a complete and holistic trust. The Data Trust Index applies these principles of trust to data and delivers a bottom-line value that makes it easy for people to understand the trustworthiness of their data.
The Data Trust Index
The Trust Framework and Data Trust Index have been many years in the making and are informed by our collective experience working with many diverse clients across various industries. We noticed that the way data quality metrics were being communicated was not intuitive enough and was leading to an adoption challenge with business users. Industry approaches have typically been technology-first and often neglected the “people” aspect. In response, we incorporated a change management ethos at the heart of our strategy and governance work, recognizing the importance of human factors such as trust in the success of any initiative, and developed a simple, easily understandable index.
Data quality frameworks have traditionally focused solely on technical data quality dimensions; the Data Trust Index places a heavy emphasis on the social trust component of confirmability to account for the emotional and cultural factors that shape how people perceive and interact with data in their organizations. The adoption and implementation of data quality frameworks have typically been regarded as the necessary step for any organization wishing to promote data democratization. Good quality data will increase use of the data, or so the logic goes. Our conviction is that a data quality framework is only the necessary first step, that true data democratization requires a holistic approach that appeals to both the logical and emotional sides of people. The Data Trust Index brings data trust out of the realm of sterile dashboards and into something tangible that instills confidence in data and helps create a culture of trust around data.
We developed the critical components of the Trust Framework (Credibility, Consistency, Confirmability) over many conversations about what was working and what wasn’t for our clients seeking benefits out of investments in data. With the help of MBA students from Schulich School of Business at York University, we transformed the framework into an implementable Index. Ideating on various algorithms and stress testing it with real life examples took many iterations before we felt comfortable taking it to clients. Now we present it here as an innovative tool to give a clear and tangible measure of your organization’s data trustworthiness.
Calculating the Index
With the Data Trust Index, companies can track their data trust over time and verify improvements in their trustworthiness against a standard. This article introduces the formula and explains it step by step.
Trust = 0.5 * (Credibility)1/Consistency + 0.5 * Confirmability
The two components of the Data Trust Index -- Personal Trust and Social Trust-- are represented by the two addends of the formula. To reflect the trust framework’s emphasis on the high value of Social Trust, each addend of the equation is weighted equally at 50:50. However, companies can adjust this weighting to represent their individual data maturity level, which we will explain below.
The Trust Index will produce a number between 0 and 1. When a data set exhibits a perfect Personal Trust score (perfect results on traditional dimensions of data quality rules over a period of time) and Social Trust score (other users have found the data set to be of value and easy to use -- documentation is accessible and complete, updates and refreshes are timely, support is available if necessary, etc.), then the data set earns a perfect score of 1.
To implement the Data Trust Index, an organization must have both a data quality tool and a metadata management tool in place. These tools create the raw numbers needed by the formula.
The Data Trust Index
Credibility. This component is an aggregation of data quality metrics across the traditional dimensions of accuracy, completeness, validity, and so on, to arrive at one number. Typically, this number is an average of the data quality dimensions an organization has chosen to measure.
The data quality tool provides the data required to calculate the Credibility score, which is typically made available through access to database schemas or APIs. Organizations can customize the calculation of this score to align with their data strategy.
Consistency. This component reflects how long a data set has been in use. With a metadata catalog in place, the consistency metric can be calculated based on the data set’s publication date and when the last major update was made to the data set. Although this is an important dimension, our formula makes sure that it does not have a disproportionate impact on the overall trust score. By defining consistency as a fractional exponent of credibility we ensure that the two trust component scores won’t undeservedly increase solely due to the passage of time. Our Data Trust Index incentivizes continual improvement and support for the users of the data as evidenced in the following example.
The relationship between Credibility and Consistency has been defined as
(Credibility)1/Consistency
To understand this relationship, let’s look at an example. One of the Canadian companies we examined was producing a material master data set for user consumption. This data set had a 70% Credibility score and a Consistency of 3 (denoting 3 monthly periods since it was first launched); this gives us a Personal Trust addend of 0.5 * (0.7)1/3 = 0.443 (44.3 %).
The team worked relentlessly to improve the data quality dimensions; their efforts pushed the Credibility score to 85%, which in turn increased Personal Trust score to 0.473 (47.3%). That represents a significant jump when you consider our Personal Trust score is capped at 50%. For the team to see a similar increase in their Personal Trust score from Consistency alone, they would have to let the data set sit at a Credibility score of 70% for 6.5 months to reach a score of 47.3%. In this way the Index incentivizes continual improvement over stagnation by ensuring that data sets don’t gain disproportionate benefit from the time factor alone. This effect is only compounded once we include Confirmability as users of a data set are unlikely to favorably rate a data set that hasn’t improved in six months.
Confirmability. This component is the Social Trust element derived from user ratings in the data catalog or marketplace. The user ratings, similar to a Google rating for a business, are typically a good measure of the value users derive from a data set.
The Confirmability score can be derived from user ratings (a functionality provided by many modern data catalogs) and exposed through APIs. Just like Credibility, the Confirmability score is expressed as a value between 0 and 1 where a rating of 3/5 will become 0.6 or 60% in our formula, for example.
The Component Ratio
The ideal ratio for the index is a 50:50 weighting across the Personal Trust and Social Trust components, but, as mentioned, organizations can adjust this to reflect their data maturity level. For example, companies in the early stages of maturity should place top priority on developing credibility in their data. Developing a culture of continually improving quality lays the foundation for the index as a whole, so in these early stages, the Personal portion of the formula may be weighted more. As a data culture develops and data catalogs are established, the Confirmability score can begin to play a greater role. At this point, organizations can consider readjusting the ratio in the formula, gradually returning it to the ideal 50:50 weighting.
The Data Trust Index
The Data Trust Index in Action
The following is a brief look at the Data Trust Index in action in a large heavy industries client seeking to democratize access to data and create a data culture in their organization. The organization had spent a lot of time and money improving the quality of their data and establishing good metadata practices but it was only when they overlayed the Confirmability aspect on top that they really began to see why data democratization was failing to take hold. We will use one data set from this example to highlight the issues they uncovered.
Trust = 0.5 * (0.8)1/2 + 0.5 * (0.3)
Trust = 0.447 + 0.15 = 0.597 = 59.7%
In the early stages of the Trust Index this particular data set had a 59.7% trust score. On closer inspection we can see that Personal Trust is quite high with a credibility score of 80%. It is the Confirmability factor which tells us where the issue lies. The data set had a rating of only 1.5 stars (out of 5) in the data catalog tool which means a confirmability score of 0.3 (1.5/5) and an overall social trust score of only 0.15. Upon further inspection as to why this data set wasn’t providing value to users, the publishers could see a common complaint was lack of documentation associated with the data set, and no planned refreshes to the data leading to people not wanting to use it.
By fixing these issues and making the data set more useable and valuable to data consumers with planned weekly refreshes, the Confirmability score went up the very next month to 3.5 stars which improved the overall Trust Index to 81.4%. This also highlighted the critical role the data stewards play as the change champions of their data. They started becoming evangelists for their data products -- getting more people to use the data and helping them enjoy a positive experience while using their data.
Trust = 0.5 * (0.8)1/3 + 0.5 * (0.7)
Trust = 0.464 + 0.35 = 0.814 = 81.4%
We can see from this small example just how the Trust Index helps bridge the gap from technical data quality scores to identify how the data can provide value to users and encourage uptake in data democratization.
Versatility: The Trust Index is also versatile in its application to different use cases and contexts. This means that in some cases, an increment of 5% is deemed significant, whereas in other cases it is not so important. The index is designed to adapt to the level of trust that consumers need from their data to deliver for a specific use case, and one example from our work with a large Canadian retailer highlights this. This retailer was implementing a specific measurement called a ”squish factor” that indicated the degree to which packages on the shelf could be compressed to accommodate more products (bags of chips being much more squishable than boxes of cereal, for example.)
In this use case, the client required a 90% trust index score for the data set to be used, which reflects the significant dollar value associated with every millimeter of space on a shelf and the knock-on effects for product waste if the numbers are wrong. In other use cases or proofs of concept it will not be required to have such a high threshold and users may think scores of over 60% to be adequate for their needs. This shows that the value difference of a Data Trust Index can have different interpretations depending on the specific use case and context in which it is applied.
Getting Started
Web services will prove to be a popular choice for organizations implementing the Data Trust Index and making the index available to data consumers through a data catalog or through the company’s internal website.
The value of the Data Trust Index lies in its ability to simplify the concept of data trust into a single, easy-to-understand number for data consumers. Data democratization is an important goal for many organizations, and a key driver for democratization is enhancing trust in the data assets an organization has. With an understandable data trust index, your organization can achieve large-scale data democratization and widespread use of your data assets.