By using tdwi.org website you agree to our use of cookies as described in our cookie policy. Learn More

TDWI Upside - Where Data Means Business

Data Stories: Pizza, Beer, and Meat Alternatives

Explore circles with an interactive data toy and infographics about food.


Slices and Sizes

sample of data visualization, linked to full visualization at Flowing Data 

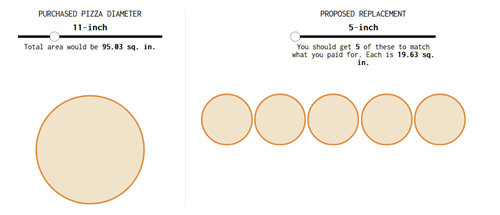
This interactive feature on Flowing Data uses pizzas to demonstrate how circle sizes can be deceptive.


Having a Drink?

sample of data visualization, linked to full visualization at Visual Capitalist 

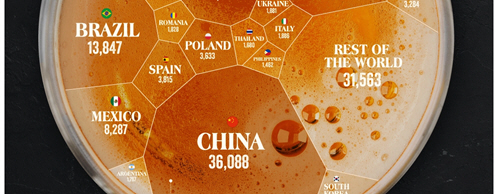
This infographic shows beer consumption around the world. The design is cute, but the style means that a viewer would have difficulty directly comparing just the shapes.


Veggie Burgers, Anyone?

sample of data visualization, linked to full visualization at Statista 

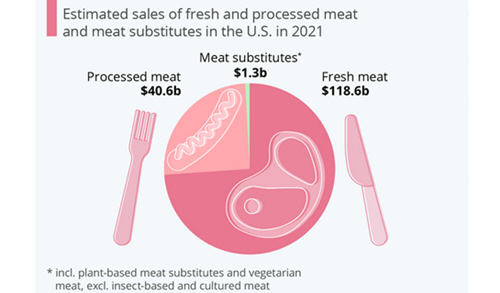
This small infographic clearly shows how small the market for meat substitutes currently is in the U.S.


TDWI Membership

Accelerate Your Projects,
and Your Career

TDWI Members have access to exclusive research reports, publications, communities and training.

Individual, Student, and Team memberships available.