
Why Data Literacy is Critical to Higher Satisfaction and Productivity
What enterprises can do to improve data literacy in their environments.
- By David Stodder
- December 9, 2020
Growth in data literacy is critical to increasing speed to insight as well as accelerating an organization's overall level of data-informed innovation. Data literacy addresses human aspects of people interacting with data. The primary goal is to raise individuals' proficiency in understanding what data means and their ability to communicate and share analytics insights, typically through visualizations such as charts and graphs.
A second important goal of data literacy is to increase recognition of people's responsibility and accountability for collecting, integrating, preparing, and protecting data. This is crucial to governance, adherence to data privacy regulations, and overall success in building trust in data and analytics through internal quality standards. An analytics culture thrives when people exercise their data curiosity and critical thinking while also taking responsibility for the data.
In a recently published TDWI Best Practices Report: Evolving from Traditional Business Intelligence to Modern Business Analytics (Q3 2020), TDWI discovered where organizations are now with data literacy and how steps for improving it could beneficially impact experiences with business intelligence and analytics. As we did for our earlier (Q1 2020) TDWI Best Practices Report: Faster Insights from Faster Data, we asked research participants how they would rate the overall data literacy of individuals in their organizations. Once again, the largest percentage of participants said their organization's data literacy is average (35 percent). The same percentage in both the Q3 survey and the previous one stated that the data literacy of individuals in their organizations is high (29 percent).
The difference this time is that more respondents say their organization's data literacy is low -- 34 percent compared to 27 percent in the previous survey (2 percent didn't know in our latest survey). Those selecting "very low" account for the difference; this percentage increased from 3 percent in the Q1 report to 10 percent in the Q3 report. Research participants for this report have a somewhat lower opinion of their organization's data literacy than participants did earlier this year.
Training and easing data access and interaction are most important. Organizations can take several steps to raise the level of data literacy. To understand which ones organizations regard as most valuable, we asked research participants to select their top five from a list of initiatives that TDWI research finds can have a positive impact on data literacy (see Figure 1). Almost two-thirds of participants (65 percent) chose perhaps the most obvious action: increase training to improve data literacy.
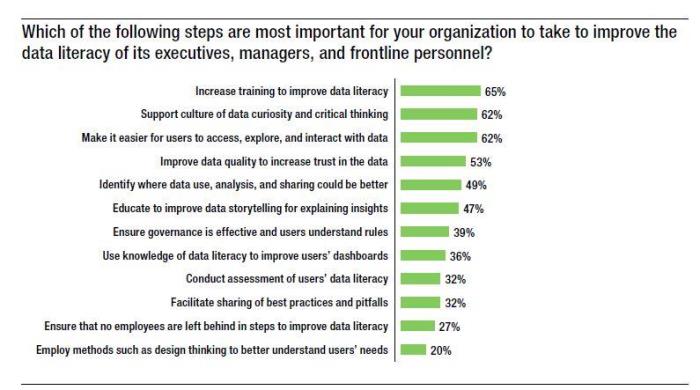
Figure 1. Based on answers from 196 respondents. Respondents were asked to select their top three to five steps. Source: Q3 2020 TDWI Best Practices Report: Evolving from Traditional Business Intelligence to Modern Business Analytics.
The same percentage (32 percent) would like to see their organizations facilitate sharing of best practices and pitfalls, which would enable individuals to help each other improve data literacy. More than one in four (27 percent) want their organizations to ensure that efforts are inclusive and do not overlook employees who may be left behind. Ensuring the appropriate data literacy of all employees is critical to becoming a fully data-informed organization.
Making it easier for users to access, explore, and interact with data is the second-most cited step (62 percent). Having the right tools and data availability can help people discover value in the data faster. Easier access, exploration, and interaction are critical to building a culture of data curiosity and critical thinking, which the same percentage of research participants (62 percent) chose. Nearly half (49 percent) believe organizations should make it a priority to identify where data use, analysis, and sharing could be better. Our research shows that rather than stand pat, many organizations want to continuously improve the user experience with data.
Data catalogs and glossaries can help advance data literacy. Many organizations are creating shared resources. Prominent among these are state-of-the-art data catalogs and related business glossaries accessible by business subject matter experts, data stewards, and other stakeholders.
Catalogs and glossaries can promote greater understanding of -- and trust in -- the data. They can advance data literacy and an analytics culture by enabling crowdsourced contributions to the catalog's and glossary's data definitions and meaning, which enlarges the enterprise's shared knowledge about data sources. AI/ML technology advances in data catalogs and glossaries enable automated discovery and the surfacing of intelligent recommendations to augment users' data exploration.
Don't neglect data quality and governance. Data quality and governance are important to data literacy. If people lose trust in the data -- by depending on a chart in a presentation that turns out to be based on inaccurate or incomplete data, for instance -- they will be reluctant to try again. More than half of research participants (53 percent) say it is important to improve data quality to increase trust in the data. A significant number also see ensuring that data governance is effective and that users understand the rules as part of data literacy (39 percent).
Business Analytics Success Requires Data Literacy
To increase the value and impact of business analytics, organizations need to raise individuals' proficiency in understanding what data means, communicating and sharing insights, and taking responsibility for the quality of data and analytics. Data literacy training should include understanding data and analytics in the individual's business context; the training can then help them turn merely "interesting" analytics and visualizations into something actionable.
Our research shows strong interest in setting up formal data literacy training programs calibrated to each person's requirements and background. Alongside these training programs (or until these are set up), organizations should try informal sharing of best practices through "lunch and learn" sessions, which could be done over video conferencing systems such as Zoom. These will improve collaboration on data even among remote users and spread both successful practices with BI and analytics as well as cautions about pitfalls to avoid.
About the Author
David Stodder is director of TDWI Research for business intelligence. He focuses on providing research-based insight and best practices for organizations implementing BI, analytics, performance management, data discovery, data visualization, and related technologies and methods. He is the author of TDWI Best Practices Reports on mobile BI and customer analytics in the age of social media, as well as TDWI Checklist Reports on data discovery and information management. He has chaired TDWI conferences on BI agility and big data analytics. Stodder has provided thought leadership on BI, information management, and IT management for over two decades. He has served as vice president and research director with Ventana Research, and he was the founding chief editor of Intelligent Enterprise, where he served as editorial director for nine years.