
Data Stories: Visualizing Things We Love, Negative Comments, and Romantic Movies
Trends in things people love and hate, experiments in social media visualization, and analyzing new romantic comedies.
- By Upside Staff
- September 26, 2018
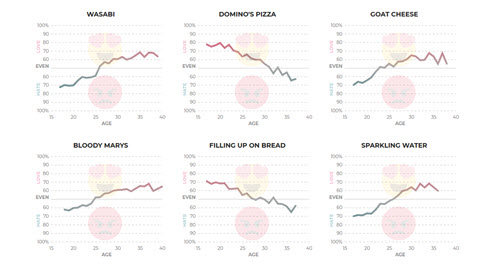
The dating app Hater asks its users to classify thousands of topics as either loved or hated. The data visualization folks at The Pudding took this data, explored trends by age and location, and found out which topics are most divisive.

When designing a visualization for a presentation on toxic Twitter comments, Peter Beshai went through multiple iterations before finding something that would be evocative, unique, and visually logical.
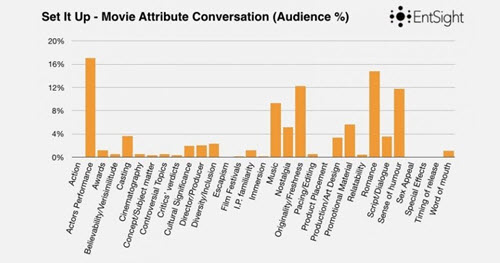
Media consultancy EntSight explored preliminary factors in the success of Netflix’s investment in new romantic comedies in this blog post.