
Data Stories: Interactive Data and Data as Art
Creating interactive visualizations in the real world, using recursive shapes to explore patterns, and the art within pi.
- By Lindsay Stares
- September 27, 2017
Visualizations in the Real World

Have you ever created a visualization that doesn’t live on a screen? This article collects examples of real-world visualizations that straddle the line between data collection and art.
Explore Recursive Space
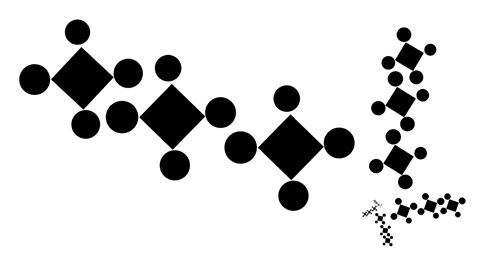
Create your own patterns with this experimental interface created for a thesis project. You can drag and resize simple shapes, and then use the compound shape you created as a solid piece. Dragging a created shape onto itself creates a fractal pattern. Make sure you take a look at the instructions (either text or video) for more options.
Numbers into Art
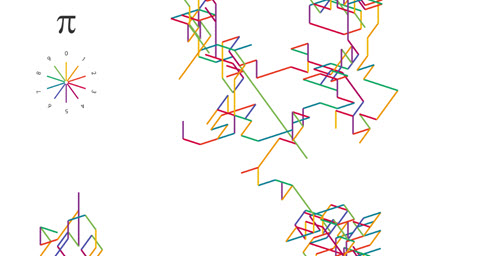
Here’s an unconventional way to look at a number; this data visualization designer turned the digits of pi into a series of colorful designs.
About the Author
Lindsay Stares is a production editor at TDWI. You can contact her here.