
Data Stories: Tech Revenues, Internet Speeds, Branding Trends
These charts show revenue streams for big tech companies, how broadband speed varies across the U.S., and how different industries use color in branding.
- By Lindsay Stares
- September 6, 2017
How Do the Tech Giants Make Their Money?
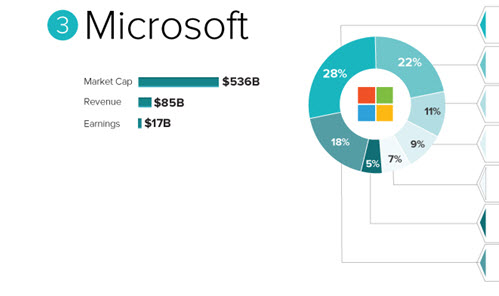
Curious about what contributes to revenue for the top five U.S. tech companies? Visual Capitalist provides this set of charts to answer that.
Internet Speed by State
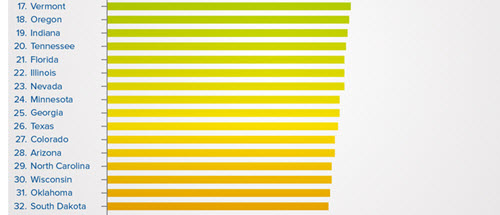
Does your home or enterprise have the broadband speed you need? It turns out that the average speed of a Web connection varies significantly across the U.S.
Does Your Branding Match Others in Your Industry?
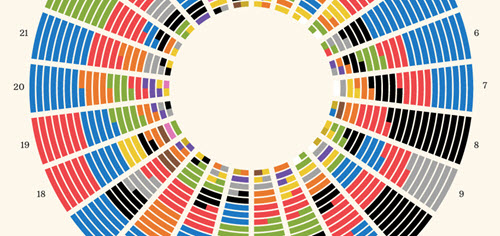
Businesses in a specific industry commonly use the same colors in their brands and logos -- for example, many restaurants use red, while communications equipment is dominated by blue and black. This infographic shows color trends across 21 industries and explains some of the psychological reasons businesses might be picking the same colors.
About the Author
Lindsay Stares is a production editor at TDWI. You can contact her here.