
Data Stories: Understanding Infrastructure, Cities, Population
Combining maps with location-specific data is a common and effective way to understand national systems and population distribution.
- By Lindsay Stares
- April 26, 2017
The Infrastructure under Our Feet

The Washington Post presents a series of interesting maps that demonstrate the scope of U.S. infrastructure, including power plants, bridges, pipelines, and railroads.
The Rise of the Megacity
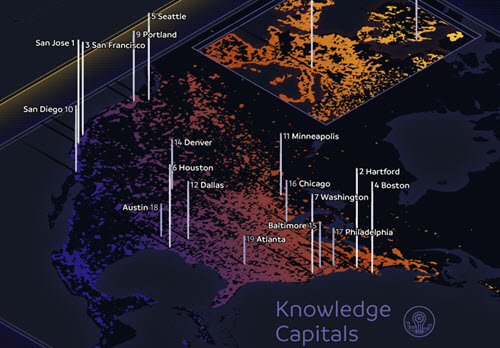
Visual Capitalist created this large infographic that explains and illustrates seven types of leading global cities. The cities are classified by their industries, trends, and investments.
Exploring Population Density
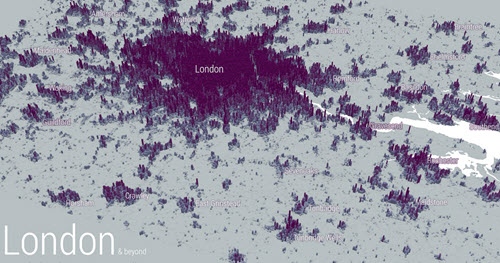
Urban analyst Alasdair Rae used open data from the European Commission to explore population density and distribution in several major cities. He explained some observed patterns and how he created the maps on his blog.
About the Author
Lindsay Stares is a production editor at TDWI. You can contact her here.