
Data Stories: Visualizing the Workplace
In these articles, learn how visualizations can provide insight into time spent working at a start-up, the morale of a development team, and the ROI of a college degree.
- By Lindsay Stares
- September 28, 2016
A Start-Up Work Week
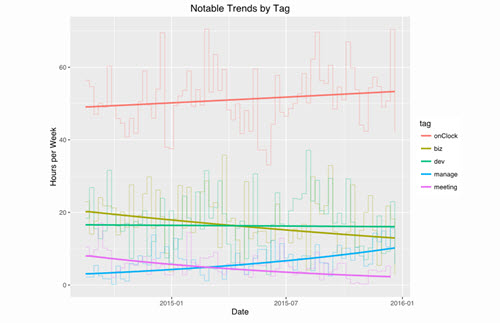
The cofounder and CTO of London-based start-up Overleaf tracked his own time use for over a year. In this blog post, he explains how he analyzed the data and what trends he found in his workload as his company grew.
Tracking Developer Morale
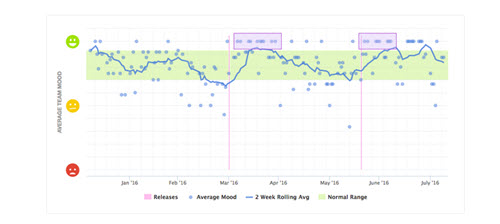
This article explains a case study for a mood-tracking app. The app team tracked a team of developers through several agile and scrum cycles and then compared changes in average morale to release dates and crunch time. The post also explains how they might use the information to help the team plan for and rebound after difficult projects.
Financial Return on Higher Education
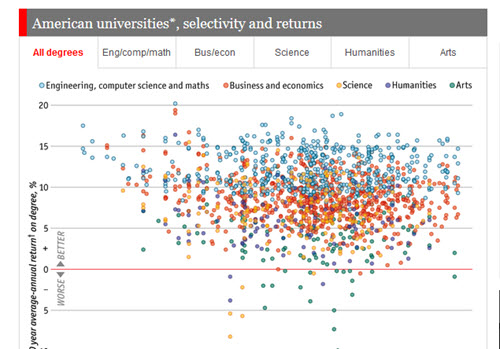
Wondering whether you made the right career choice in picking a college or university? This chart from The Economist compares the prestige of a school to the average ROI of a degree in various majors. (Yes, STEM careers come out on top.)
About the Author
Lindsay Stares is a production editor at TDWI. You can contact her here.