
Data Stories: NY, NY -- A Heck of a (Data-Filled) Town
With eight million people across five boroughs, New York City creates a lot of data to explore! Learn how people are using public data to examine police statistics, land use, and even the trees on the streets.
- By Lindsay Stares
- June 29, 2016
The open data movement is active in NYC, and the city government has provided public access to certain data sets. Here are three ways people have used this data to visualize the city and discover something new.
Correcting the NYPD
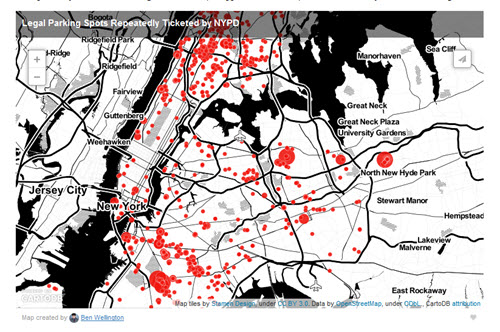
Statistics professor Ben Wellington uses the NYC data sets to investigate many topics -- everything from the cleanest fast food restaurants to the murder rate in the most dangerous neighborhoods. He believes that transparency around data can help citizens and government work together for a better city.
Recently, he found that parking ticket data showed a huge number of tickets were being issued at legal parking spaces! Read his article for the full story, including how he looked at the data and the response from the NYPD.
Accounting for Real Estate
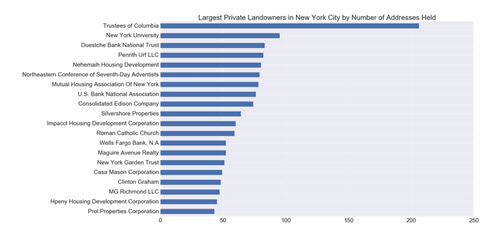
Anyone with analytics knowledge can benefit from this type of public data set. CUNY student Aleksey Bilogur used the city data to find the top landowners in NYC. This blog post includes charts and interactive maps showing which public and private institutions own the most addresses, the most square footage, or the most expensive real estate.
Adding up the Plant Life
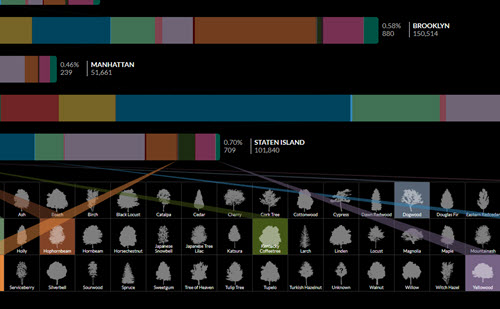
Hundreds of thousands of trees line New York’s streets, but what kinds of trees? Digital design and strategy firm Cloudred took the city data and created a lovely, interactive chart of all the trees by species. The format allows you to add and subtract tree types by clicking and see the distribution at a glance.
These data explorations are only the beginning. What else could you do with the NYC open data sets?
About the Author
Lindsay Stares is a production editor at TDWI. You can contact her here.