Tableau: On a Mission for Everyone to See and Understand Data
Tableau continues strong momentum in visual data discovery and outlines its themes for its next release.
- By Cindi Howson
- September 15, 2014
The Tableau Conference rocked Seattle last week with a record 5500 customers, partners, and employees in attendance. Tableau has rapidly become the darling of Wall Street and data lovers, growing at a rapid 82 percent year-over-year, faster than any other BI vendor, and yet, co-founder and vice president of product development Chris Stolte says, “We’re in inning number one. We are constantly thinking about what’s the next big thing we need to address to fulfill our mission” to help the world see and understand data.
Their Secret to Success
Tableau’s success to date can be explained by three main factors: ease of use, agility, and visualization.
BI adoption has been stubbornly flat for years, in part held back by hard-to-use tools that remained predominantly in the hands of power users. Tableau is easy to deploy, easy to learn, and easy to use. At the same time, the need for faster access to data, new data sources beyond a centralized data warehouse, and a fiercely competitive business environment have led agility to trump perfectly architected. As one customer summed up at the conference this week, “Business questions have a shelf life.” The window of opportunity from a decision or insight seems increasingly shorter.
Although many BI tools have long supported the ability to create charts, Tableau’s charts have been the primary display rather than an afterthought. With its origins in Stanford and Disney’s Pixar, their visualizations have combined entertainment with expertise in visual perception.
A number of other visual data discovery vendors, namely Qlik and TIBCO Spotfire, have gained traction for these same three reasons, but with varying strengths. In the last few years, BI platform vendors have been adding visual data discovery capabilities to their portfolios, but it is hard to hit all three high notes equally well, and Tableau has had an eight-year head start.
Key Investment Areas
Much of the product news centered on incremental improvements, with perhaps one item I would dub a breakthrough. CEO Christian Chabot kicked off the keynote (viewable in its entirety) declaring the company is on track to invest more R&D in the next two years than it did in the last ten. He outlined seven main investment areas:
- Visual Analytics
- Performance
- Data preparation
- Storytelling (see my article on 4 approaches to storytelling)
- Enterprise
- Cloud
- Mobile
Here is my take on three of those areas.
Data Preparation
The three areas that most attracted my attention were data preparation, enterprise enablement, and mobile. In the era of big data and agility, business needs access to more data sources, faster. Data can come from the Web, machines, suppliers, and customers. That data can be messy. Tossing it over to IT for extensive ETL does not lend itself to agility. Giving business users the ability to do simple clean up, such as split columns or unpivot crosstab tables, is a better approach, particularly for departmental data sources and/or data sources of unknown value.
These are areas that competitors SAP (in Lumira) and Microsoft (in Power Query) have been a step ahead of Tableau. The biggest wow, though, was the ability to take Web-based data with blank rows, merged cells, and distributed tables (think of an SEC 10Q) and import it into Tableau in a single click. I was impressed with the demo, but I will remain skeptical that it’s truly that easy until I’ve tested it.
At first blush, I thought the new data prep features could be bad news for partners Alteryx, Paxata, and Trifacta, but these vendors are able to do such business data preparation across multiple data sources, whereas Tableau seems to be working off a single source.
Visual Data Discovery across the Enterprise
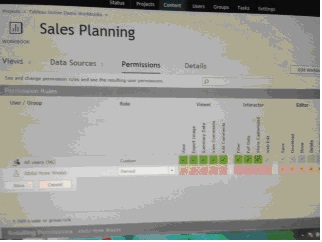
Enterprise enablement and balancing control with freedom was a theme of many of the track sessions at the conference. Customer Deloitte is one of the largest deployments, with 40,000 named users. Maintaining permissions for so many users is not an easy task in any BI tool. Here, Tableau showed how they are using their visualization expertise to better help administrators visualize those permissions and usage. The image below shows a screenshot of a heat map of user permissions and how they got it: either explicitly or inherited via a group membership.
Mobile
Mobile has been an area of relative weakness for Tableau. Customer Ancestry.com cited limitations in mobile as a specific reason they have multiple BI tools. Tableau expects to add offline capabilities in the next release, with a scheduled synchronization. However, the initial release for the offline dashboard is expected to be static. The company also introduced project Elastic. In their mission to help all people use their data, Tableau is targeting mobile users who receive tabular data via e-mail, Dropbox, or apps that use Health Kit on a tablet device. Project Elastic is a Tableau app that takes that tabular data and immediately renders it as a bar or line chart. Users can swipe the data to filter and drill. This app goes far beyond the current business user base to casual consumers.
Room for Improvement
Tableau is focusing on improving its core capabilities, but I was disappointed there was no mention of search or of better scheduling options. Customer Facebook gave a presentation on how they have developed their own scheduling solution and intends to share it with the community via their blog. Other attendees were frustrated by the lack of clarity on release dates and capabilities, a transparency they have enjoyed in the past when the company was privately held. In this regard, Tableau has said that its next major release, version 9, will ship in the first half of next year. They won’t say for sure what’s in that release as they have moved to a more agile development methodology.
Combining Inspiration and Education
As user conferences go, Tableau knows how to capture the spirit of a passionate group of customers. It’s not just an educational and networking experience; it feels more like a pep rally, with Tableau employees manning the conference. Quite frankly, it is reminiscent of a number of BI conferences before the industry consolidation in 2008. One of my favorite parts is the Tableau Doctor where developers meet one on one with customers on their particular questions and dashboard designs. The guest speaker keynotes were inspiring, starting with Dr. Tyson, host of the Cosmos TV series, talking about telling stories with science. Author Michael Lewis (Moneyball, Blind Side, and Flash Boys) shared his experiences with disrupters and the backlash when people don’t like what the data is saying. (Did you know that Blind Side almost wasn’t made because producers cited no commercial potential? The film was bootstrapped!) I missed author John Medina of Brain Rules, but his book is a must read for understanding how we learn, think, and retain information. For those of us who wish we could clone ourselves to attend competing track sessions, all of them were recorded to be viewed on demand post conference.
About the Author
Cindi Howson is the chief data & AI strategy officer at ThoughtSpot and host of the award-winning The Data Chief podcast. Cindi is an analytics and AI thought leader and expert with a flair for bridging business needs with technology, spanning 30 years. As chief data & AI strategy officer at ThoughtSpot, she advises top clients on data and AI strategy and best practices to become data-driven; speaks internationally on top trends such as agentic AI, creating a data culture, aligning to business value, and AI ethics; and influences ThoughtSpot’s product strategy.
She has been named a Top 25 AI Executive by Software Report in 2024, DataIQ100 in 2023 & 2024, Motivator of the Year by Women Leaders in Data and AI (WLDA) in 2022, and CDO Magazine named her a Leading Data Consultant and Global Data Power Woman in 2022 and 2023. Prior to joining ThoughtSpot, Cindi was a Gartner Research VP. She is the author of six data industry books and teaches AI for Executives for GenAI.Works.