Pervasive Business Intelligence: Systems Theory and Business Intelligence
By Wayne W. Eckerson
The BI Tipping Point
Does this scenario sound familiar?
You’ve deployed BI tools, and usage spikes—but then gradually declines. Some users are generating lots of reports, in fact way too many. Other users still request custom reports, and your backlog has grown bigger instead of smaller. People who have tried the BI tool say the “data isn’t right” and performance is poor. You then spend the next six months reconciling your reports to legacy systems to verify that the data in your reports is accurate—which you already knew, but you can’t seem to convince certain vocal and influential users. You also discover that several analytics experts are bogging down BI performance by issuing massive queries against the data warehouse so they can populate their local data sets.
Although you and your team are working harder than ever, upper management is beginning to question the value of BI. They’ve invested considerable money and hear only negative feedback, and they have yet to see significant payback. BI has become a dirty word within the organization, and it’s likely that your funding will get reduced or eliminated next year. Your reputation is on the line, and there’s not much you can do to salvage it.
Unfortunately, too many BI teams are stuck in this scenario or some version of it. They are caught in a negative feedback cycle that seems impossible to change. There seems to be no magic formula that can cure this malady.
The Lucky Few. What makes this situation intolerable is that a few lucky teams seem to experience the opposite phenomenon. Instead of witnessing decelerating usage, they can’t keep up with demand for new BI applications, data, and BI licenses. Rather than circumventing the BI offerings, business users pitch ideas to the BI team for how to leverage the BI platform to drive new value to the organization. Not surprisingly, these BI teams boast strong partnerships with sponsors and users who are actively involved in setting priorities and direction for the BI portfolio via BI steering committees or a BI center of excellence. In addition, executives recognize BI as a strategic asset that delivers huge ROI and almost immediate payback from their investments. They give BI priority in the IT budget and want to expand the team to keep up with demand.
Hopefully, you are among the fortunate few whose teams are immersed in the exuberant whirlwind of a positive feedback cycle. It’s clear that you’ve passed a magical tipping point where every effort amplifies user satisfaction and business value. It seems like there is nothing you can’t accomplish.
Have and Have Not. Obviously, there is a huge disparity between these two scenarios. The BI “haves” are caught in a positive reinforcing cycle, while the BI “have nots” are stuck in a negative reinforcing cycle. What’s true in life is also true in BI: the rich get richer, and the poor get poorer.
“On one end of the spectrum are IT shops that are order takers, reacting to user requests and creating a backlog that gives rise to spreadmarts. On the other end, BI is proactive and driven by the business. Here, designated ‘super users’ in each department create reports for themselves and their colleagues using self-service BI tools with support from the BI team. Since they reside in the business, they can anticipate requests before they happen and deliver better reports faster,” says M. C. Sankar, senior vice president of Wachovia Securities.
Breaking the Cycle. Sankar has a formula for BI shops that want to cross the tipping point and change roles from reactive order takers to proactive providers of information and insights: 1) get strong executive sponsorship; 2) educate managers and users about the importance of fact-based decision making and the dangers of spreadmarts; and 3) establish a partnership with power users in each department and meet with them weekly to prioritize BI initiatives.
“At this point, they stop complaining that IT isn’t delivering because they are part of the solution. They also see how individual requests can be consolidated to serve multiple needs, improving efficiency,” says Sankar. This group also selects tools, develops a semantic layer, trains their business counterparts to use them, and recommends enhancements to improve the user experience, such as upgrading the platform to optimize performance.
“As soon as backward demands are satisfied, then people start looking forward. BI gets embedded in the way people make critical decisions, and that’s when you have a huge uptick in usage,” says Sankar.
BI Counseling. The key to breaking a negative feedback cycle is to understand the dynamics driving it, find the leverage points, and take action. We can use systems theory to understand what we’re facing, but it takes a lot of willpower, perseverance, and discipline to take action that changes system dynamics. The challenge is similar to what an alcoholic faces in trying to break an addiction or a married couple faces in trying to repair a soured relationship.
This report will serve as professional BI counseling to help you recognize the system dynamics that might be undermining your ability to meet user needs. It will also help identify leverage points that you can use to help ensure your BI solution is widely adopted and used.
“Limits to Growth” Archetype
Feedback Loops. In his groundbreaking book, The Fifth Discipline, Peter Senge says that systems theory “is a discipline for seeing wholes ... a framework for seeing interrelationships rather than things.” Systems theory depicts various types of feedback loops that show how actions can reinforce or balance each other. Reinforcing loops accelerate quickly—either for good or bad—and often catch people by surprise. Change often happens slowly at first, and rapidly at the end. For example, according to systems theory, we can expect the effects of global warming—which are mutually reinforcing—to accelerate rapidly and more quickly than most people anticipate.
Archetypes. Some types of feedback loops work in concert to form “patterns of structure” that occur repeatedly. Senge calls these “systems archetypes.” One of the most common systems archetypes is called “limits to growth.” By applying this archetype to BI, we can understand why some BI teams face an uphill battle to increase adoption and usage, while others grow at a rapid clip. It can also help identify leverage points that enable struggling teams to reverse the dynamic and start growing, or that cause fast-growing teams to hit a wall and go into decline.
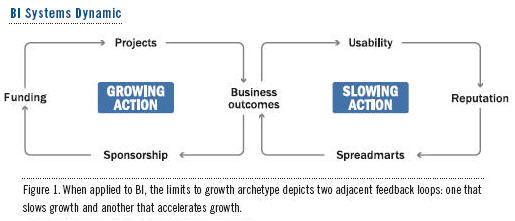
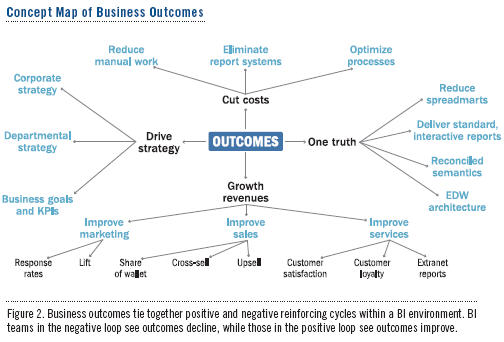
BI Dynamics. Figure 1 shows a “limits to growth” archetype applied to BI. It consists of two adjacent feedback loops: one that inhibits growth (i.e., a negative reinforcing cycle) and another that accelerates it (i.e., a positive reinforcing cycle). Both hinge on a single condition called “business outcomes,” which represents the value that the BI solution offers the organization. (See Figure 2 for a concept map of business outcomes.)
Negative Cycle. The right-hand cycle shows how a lack of usability in a BI solution gives the BI team a bad reputation, which causes users to create spreadmarts—renegade BI systems or data shadow systems built outside of IT—rather than use the corporate-provided BI tools. This causes executives to question the value of their BI investment and reduce funding, which further limits a BI team’s ability to deliver a usable solution. The cycle repeats until the organization either cancels the BI program or the BI team finds a way out of the negative loop.
Some BI teams break this cycle by finding time within an ever-growing backlog to deliver a “quick-hit” application or dashboard that is easy to use and highly performant. Word spreads quickly, and soon other groups want a similar application. They petition senior executives to fund an expansion of the BI application and perhaps other new BI initiatives. With an infusion of support and funding, the BI team ramps up its existing data infrastructure, accelerating deployment times and usability. As its reputation builds, the BI team frees itself from the negative reinforcing loop.
Positive Cycle. The left-hand cycle depicts how business sponsors fund new BI projects that lead to positive business outcomes. Once a BI project demonstrates that it can reduce costs, increase revenue, or advance business strategy, executives are likely to boost funding to undertake new projects, which add more business value. This positive reinforcing cycle accelerates until it reaches the natural limits of its growth and begins to reverse course. (Hence the archetype name, “limits of growth.”)
In BI, this reversal happens when the BI team grows too big to work efficiently and its architecture and standards become too ponderous to respond rapidly to user requests. As a result, user satisfaction declines and the growth of the BI initiative slows. Unless the BI team moves quickly to improve responsiveness, the BI initiative will switch from the positive to negative feedback cycle and begin to contract rapidly. External events can also derail a fast-growing BI initiative, such as an across-the-board budget cut or a new strategic initiative that reallocates BI resources to other projects.
Given the fluidity of these feedback cycles, BI teams need to continually monitor the momentum of their BI initiatives to ensure they are on the right track. “We’ve crossed the threshold where the business is now excited by what we have to offer,” says a BI director at a large financial services firm that recently deployed dashboards and a data warehousing appliance to augment an enterprise data warehouse that took years to build. “But we are cautious, because we know that it can tip back the other way very quickly.”
Leverage Points
According to Senge, most people react to limits-to-growth situations by trying to push too hard. “Unfortunately, the more vigorously you push the familiar levers, the more strongly the balancing process resists, and the more futile your efforts become.” Senge recommends finding the leverage points within the systems, which often “require actions you may not have considered, choices you never noticed, or difficult changes in rewards and norms.” In other words, sometimes we have to challenge our innate assumptions about what works—and try doing the opposite.
Backsliding. For example, many BI teams find themselves at a crossroads after they consolidate shared data elements into an enterprise data warehouse and centralize development within an enterprise BI team. Although they deliver high-quality solutions and ensure a single version of truth, the centralized team now struggles to keep up with user demand and becomes a bottleneck to growth. Most BI teams in this situation buckle down, work harder, and plead for more funding and resources to grow the team, expand the hardware platform, and increase database performance. While all these things might be necessary, they are usually not enough to counter the system dynamics that the team has created through its own success.
The primary option is counterintuitive. Instead of continuing to expand central operations, the team must forfeit hardwon control and distribute ownership back to the business units. This is a scary proposition for most BI teams, because business units can easily undermine information consistency by creating non-standard data marts, cubes, reports, and so on. But if the central BI team doesn’t distribute work to business units, users will become so dissatisfied with the pace of development that they will build their own systems (i.e., spreadmarts) anyway, derailing the BI initiative and moving it into a negative feedback loop.
In this situation, enlightened BI executives recognize that they need to give back some control to continue growing. “We will soon hit the wall, and it’s clear that we need to decentralize our operations if we want to achieve the kind of growth and capabilities the business desires long-term,” said a BI director at a major manufacturing firm.
In a decentralized environment, BI managers maintain “control” by defining standards for development rather than performing the development themselves. They define standards for project management, ETL processes, data quality, and other architectural elements. They educate remote developers about these standards and review their work to ensure that they are adhering to the standards. In this way, BI teams maintain a reinforcing cycle of growth.
Components of Leverage. In the world of BI, each element within the dual feedback loops is a point of leverage that BI teams can use to alter the cycle of growth or decline: usability, reputation, spreadmarts, sponsorship, funding, and projects (see Figure 1).
For example, there are numerous techniques to eliminate spreadmarts, such as my five Cs: communicate, coerce, convert, coexist, and co-opt. There are also dos and don’ts for acquiring sponsorship for an initial project or ongoing program.
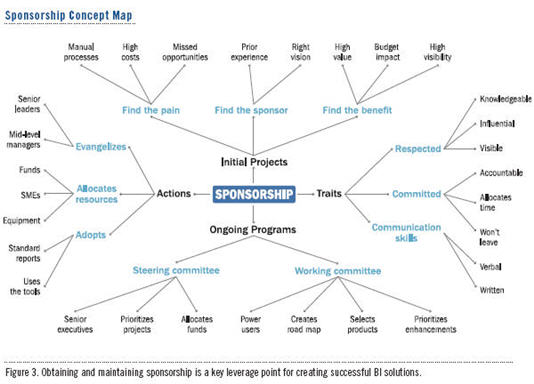
“BI projects succeed from the top down with strong executive sponsorship; I’ve never seen it successful from the bottom up,” says Mike Ferrante, manager of data services at Habitat for Humanity International. (See Figure 3 for a concept map of sponsorship.)
Usage and Projects. While sponsorship and spreadmarts are important elements, the two most powerful leverage points for changing the nature of system dynamics within a BI environment are usability (see Figure 11) and project management. These are areas in which BI professionals can exert the most control over the shape of the BI environment and its eventual outcome. By focusing efforts here, BI managers can obtain the necessary leverage to change system dynamics and move their initiatives in a positive direction.
However, each leverage point is complex in its own right, consisting of multiple components and subcomponents, each of which can affect the usability of the system or the effectiveness of a project overall. Typically, BI teams need to address all the components within a leverage point to ensure a successful outcome. This is the equivalent of juggling multiple balls at once without dropping any.
Recommendations
The key to making BI pervasive is persuading users to adopt and use the BI tools that an organization purchases for them. This seemingly straightforward equation is actually very complex because of all the variables that go into making a BI tool easy to use. It’s why the penetration of active BI users in organizations is only 24%.
To increase the adoption of BI tools, we recommend the following:
1. Although the cost of BI tool licenses is not insignificant, the real costs are the time and complexity to configure the tools and integrate them into an existing architecture (e.g., security, Web servers, databases, etc.) These costs increase exponentially in an enterprise deployment. Therefore, one way to make the cost of BI tools more affordable is to deploy them departmentally first, gain buy-in, and then expand incrementally.
2. Conduct an inventory of users to ensure that you purchase only the licenses you need. For example, many casual users may need only static reports pushed to them each night via email or to a Web folder. Replacing full-client licenses with less expensive “recipient” licenses will reduce overall license and maintenance costs and make it more affordable for your company to purchase licenses for all who need them.
3. Create a working committee of power users from each department, and have them create a roadmap for BI with IT’s assistance. Getting the power users on board will create a cost-efficient program that prioritizes the delivery of BI functionality in an optimal way, leaving more time and money to purchase and deploy the right BI tools for each category of user. There are many factors involved in making BI pervasive, and BI teams need to address all of them. Systems theory can help BI teams understand the dynamics that drive BI initiatives. With this understanding, BI teams can better focus their efforts and increase their chances of delivering a successful solution.
Wayne W. Eckerson is the director of Research at TDWI. He is an industry analyst and the author of Performance Dashboards: Measuring, Monitoring, and Managing Your Business (John Wiley & Sons, 2005). He can be reached at [email protected].
This article was excerpted from the full, 32-page report, Persuasive Business Intelligence: Techniques and Technologies to Deploy BI on an Enterprise Scale. You can download this and other TDWI Research free of charge at tdwi.org/bpreports.
The report was sponsored by Business Objects, an SAP company; Corda Technologies; InetSoft Technology Corp.; LogiXML; Microsoft; MicroStrategy; SAS; and Strategy Companion.
This article originally appeared in the issue of .