Infographic | Visual Analytics for Making Smarter Decisions Faster
August 21, 2015
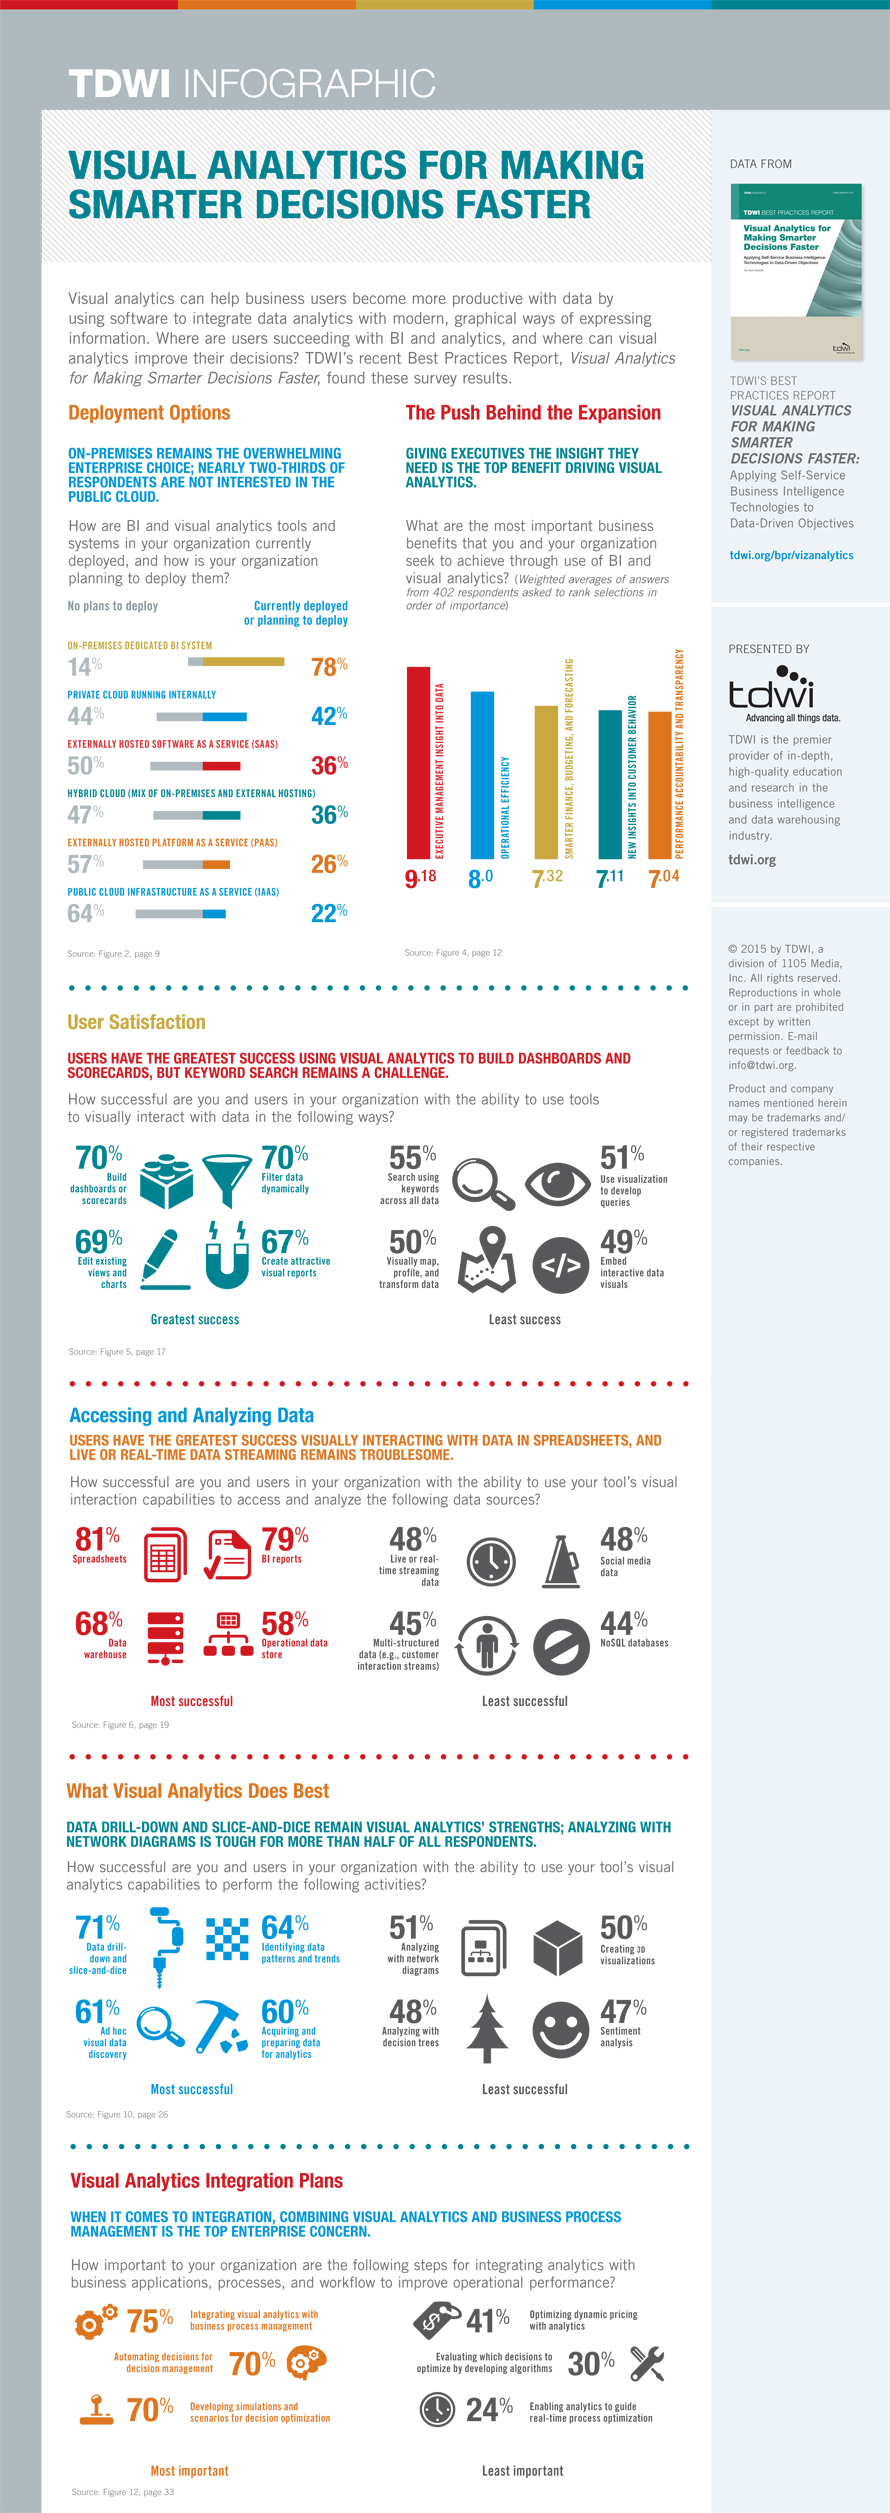
Visual analytics can help business users become more productive with data by using software to integrate data analytics with modern, graphical ways of expressing information. Where are users succeeding with BI and analytics, and where can visual analytics improve their decisions? TDWI’s recent Best Practices Report, Visual Analytics for Making Smarter Decisions Faster, found these survey results.
Download the Infographic
Download the Best Practices Report
Share this infographic on your page! Just copy and paste the HTML below: