
Data Stories: Estimating and Representing Groups
Estimating the size of population groups in the U.S., how households have changed over time, and disparities in how Congress represents the U.S. population.
- By Upside Staff
- March 30, 2022
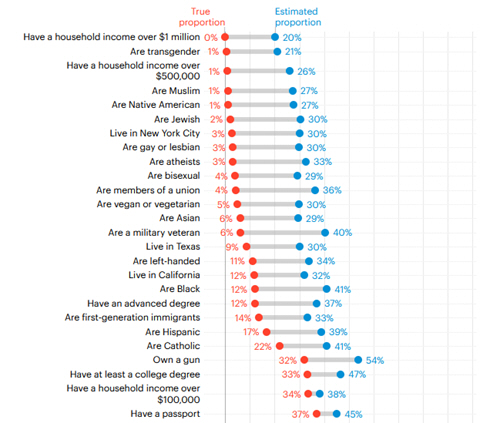
Americans surveyed by YouGov consistently overestimate the size of minority groups and underestimate the size of majority groups.
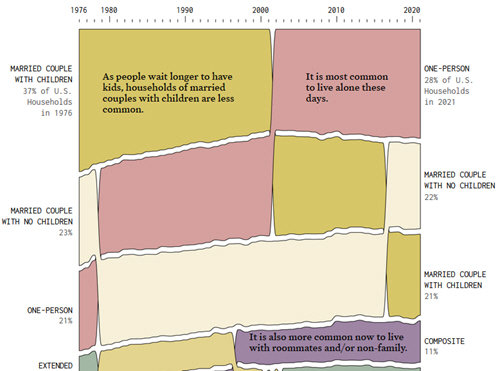
This diagram from Flowing Data shows how who lives together in the U.S. has changed over time.
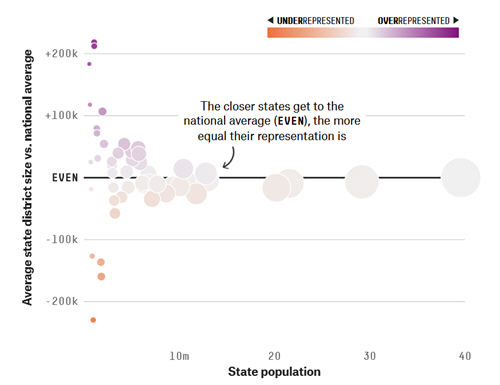
Under the current rules for apportioning members in the U.S. House of Representatives, the people in some states are over- and underrepresented compared to the average. These interactive charts from FiveThirtyEight illustrate what that means and what would happen if the size of Congress was adjusted to accommodate today’s population.